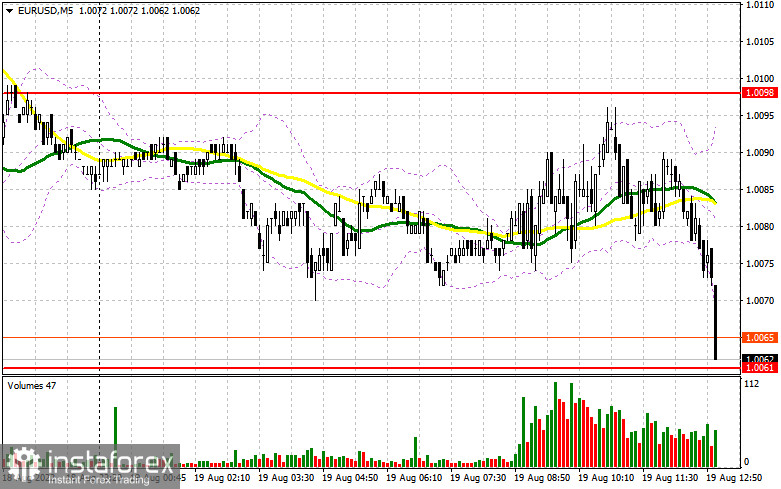
In the morning article, I highlighted the level of 1.0098 and recommended making decisions with this level in focus. Now, let's look at the 5-minute chart and try to figure out what actually happened. A sharp rise in the Producer Price Index for Germany undermined the upward movement of the euro in the first half of the day. Notably, the momentum was rather weak. Unfortunately, the pair did not reach the 1.0098 level. Therefore, there was no sell signal. The technical outlook for the second half of the day has not changed as well as the strategy.
What is needed to open long positions on EUR/USD
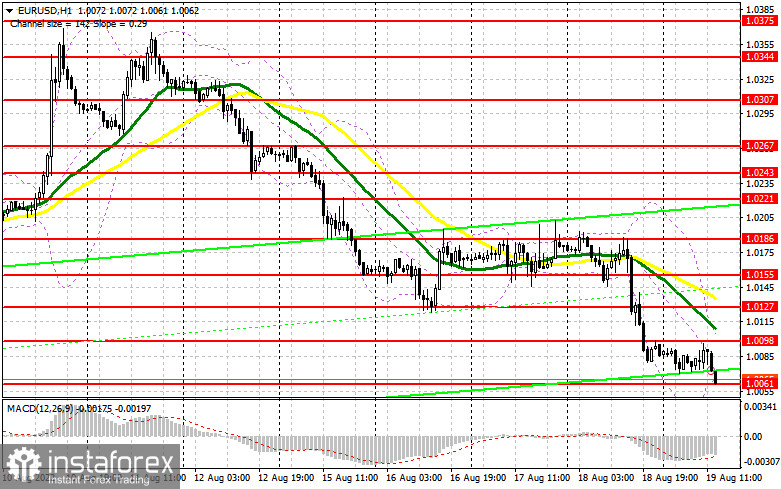
Given that the economic calendar will be completely empty in the American session, the euro may extend losses. The bears are now tightening their grip not only on the euro but also on crypto and other assets. Recession fears are intensifying again. For this reason, traders are trying to lock in profits before a potential massive sell-off. If the euro/dollar pair declines lower, which is more likely, only a false breakout of 1.0061 will give a buy signal. It will open the way to the nearest resistance level of 1.0098 formed yesterday. A breakout and a downward test of this level will force the bears to close their Stop Loss orders, providing an additional buy signal with the prospect of a rise to 1.0127. A more distant target will be the resistance level of 1.0155 where I recommend locking in profits. If EUR/USD declines and the bulls show no activity at 1.0061 in the afternoon, the pressure on the pair will escalate. The best option for opening long positions will be a false breakout of 1.0037. You can buy EUR/USD at a bounce from 1.0008 or a low of 0.9958, keeping in mind an upward correction of 30-35 pips.
What is needed to open short positions on EUR/USD
As traders are unwilling to open new long positions, the euro is likely to fall. I was hoping to get a sell signal at 1.0098 in the morning but it did not happen. The main task of sellers for the American session is to protect a large resistance level of 1.0098. The optimal scenario for opening short positions will be a false breakout of this level. If so, the pair is likely to decrease to 1.0061. A breakout below this level may take place in the near term as the bulls will hardly be able to defend this level. An upward test will generate an additional sell signal. The bulls will have to close their Stop Loss orders. as a result, the pair could decline to 1.0037. After that, it could reach again the parity level with the US dollar where I recommend locking in profits. A more distant target will be the 0.9958 level. If EUR/USD rises in the afternoon and the bears show no energy at 1.0098, the bulls may assert strength. Additionally, many traders are likely to close their positions at the end of the week. In this case, it is better to postpone short positions to 1.0127 but only after a false breakout of this level. You can sell EUR/USD immediately at a bounce from a high of 1.0155 or 1.0186, keeping in mind a downward correction of 30-35 pips.
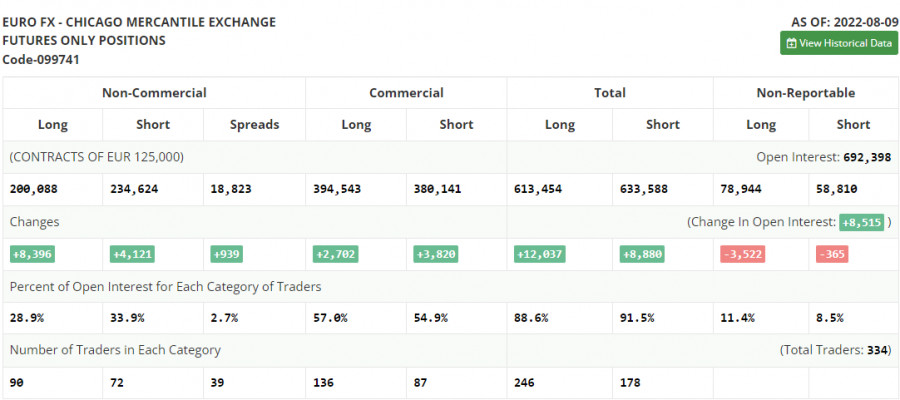
COT report
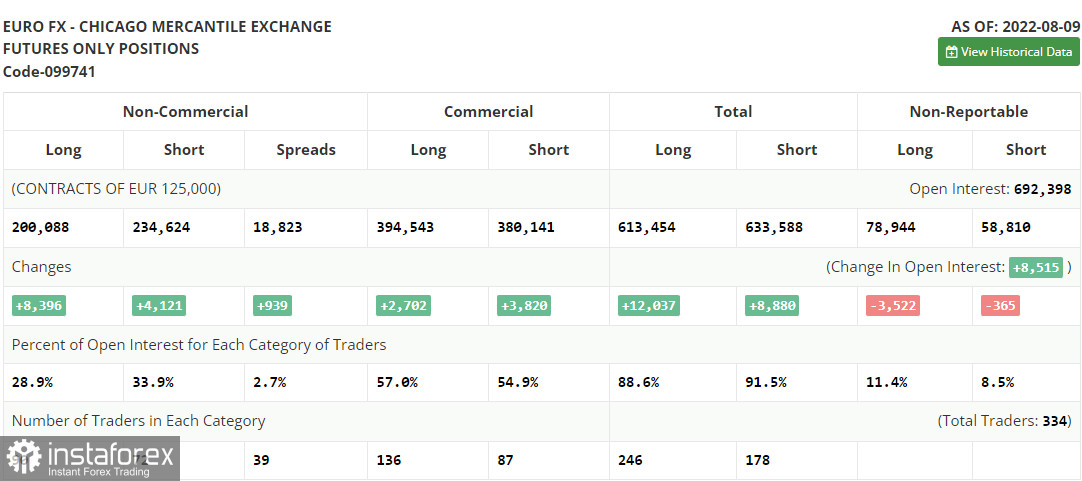
The COT report (Commitment of Traders) for August 9 logged a sharp increase in both short and long positions. However, the number of short positions turned out to be bigger, which indicated the gradual end of the bear market and an attempt to find the bottom after reaching the parity level. Last week, US fresh macro stats were released, which turned everything upside down. The CPI report showed the first slowdown in inflation after reaching a peak of 10.0%. It fueled demand for risky assets. As seen on the chart, risk aversion soon returned to the market. Traders are unwilling to increase long positions due to the risks of a global recession. No crucial economic reports are expected this week that could facilitate the growth of the euro. Therefore, the euro is likely to stay in the sideways channel. There could hardly be sharp trend reversals before the fall of this year. The COT report revealed that the number of long non-commercial positions rose by 8,396 to 200,088, while the number of short non-commercial positions jumped by 4,121 to 234,624. At the end of the week, the total non-commercial net position, although it remained negative, climbed slightly to -34,536 from -39,811, signaling a shift to the bull market. The weekly closing price climbed to 1.0233 against 1.0206.
Signals of technical indicators
Moving averages
EUR/USD is trading below 30- and 50-period moving averages, signaling a further decline in the euro.
Remark. The author is analyzing a period and prices of moving averages on the 1-hour chart. So, it differs from the common definition of classic daily moving averages on the daily chart.
Bollinger Bands
In case of a rise, the upper border of 1.0098 will act as resistance.
Definitions of technical indicators
- Moving average recognizes an ongoing trend through leveling out volatility and market noise. A 50-period moving average is plotted yellow on the chart.
- Moving average identifies an ongoing trend through leveling out volatility and market noise. A 30-period moving average is displayed as the green line.
- MACD indicator represents a relationship between two moving averages that is a ratio of Moving Average Convergence/Divergence. The MACD is calculated by subtracting the 26-period Exponential Moving Average (EMA) from the 12-period EMA. A 9-day EMA of the MACD called the "signal line".
- Bollinger Bands is a momentum indicator. The upper and lower bands are typically 2 standard deviations +/- from a 20-day simple moving average.
- Non-commercial traders - speculators such as retail traders, hedge funds and large institutions who use the futures market for speculative purposes and meet certain requirements.
- Non-commercial long positions represent the total long open position of non-commercial traders.
- Non-commercial short positions represent the total short open position of non-commercial traders.
- The overall non-commercial net position balance is the difference between short and long positions of non-commercial traders.