Analyzing Thursday's trades:
EUR/USD on 1H chart
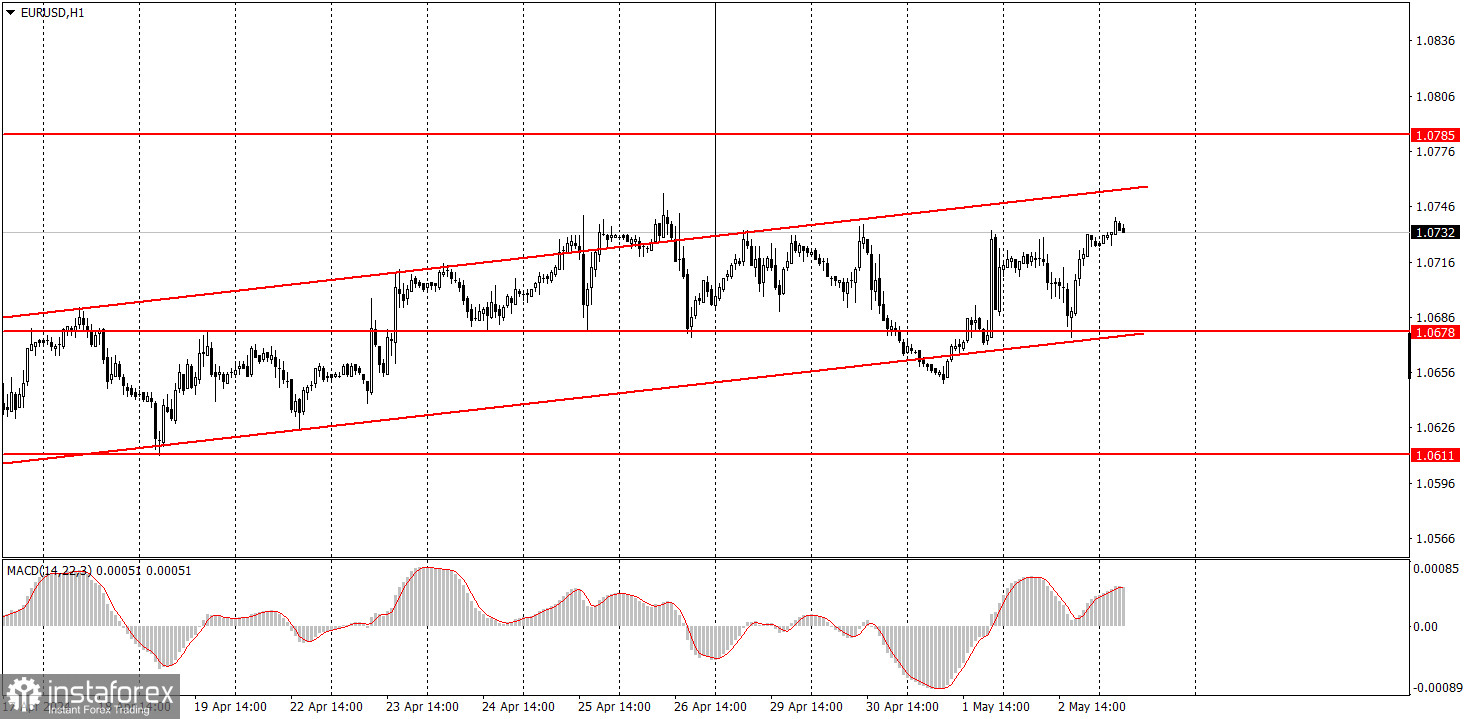
The EUR/USD pair traded within an ascending channel on Thursday, which it should have already broken out of. In fact, we are still observing a weak upward correction over the past few weeks while the global downward trend persists. Since Wednesday and Thursday, twice we have seen the price make an attempt to settle below the channel and bounce off its lower boundary, which is why it was logical to expect an upward movement. There were no fundamental or macroeconomic reasons for such a movement. Take note that the outcome of the FOMC meeting cannot be considered dovish since Federal Reserve Chair Jerome Powell expressed uncertainty regarding the timing for a potential rate cut. Yesterday, there were no events or reports at all (important ones), so the movements were purely technical. But we still have an ascending channel, so it is enough to simply trade within its boundaries.
EUR/USD on 5M chart
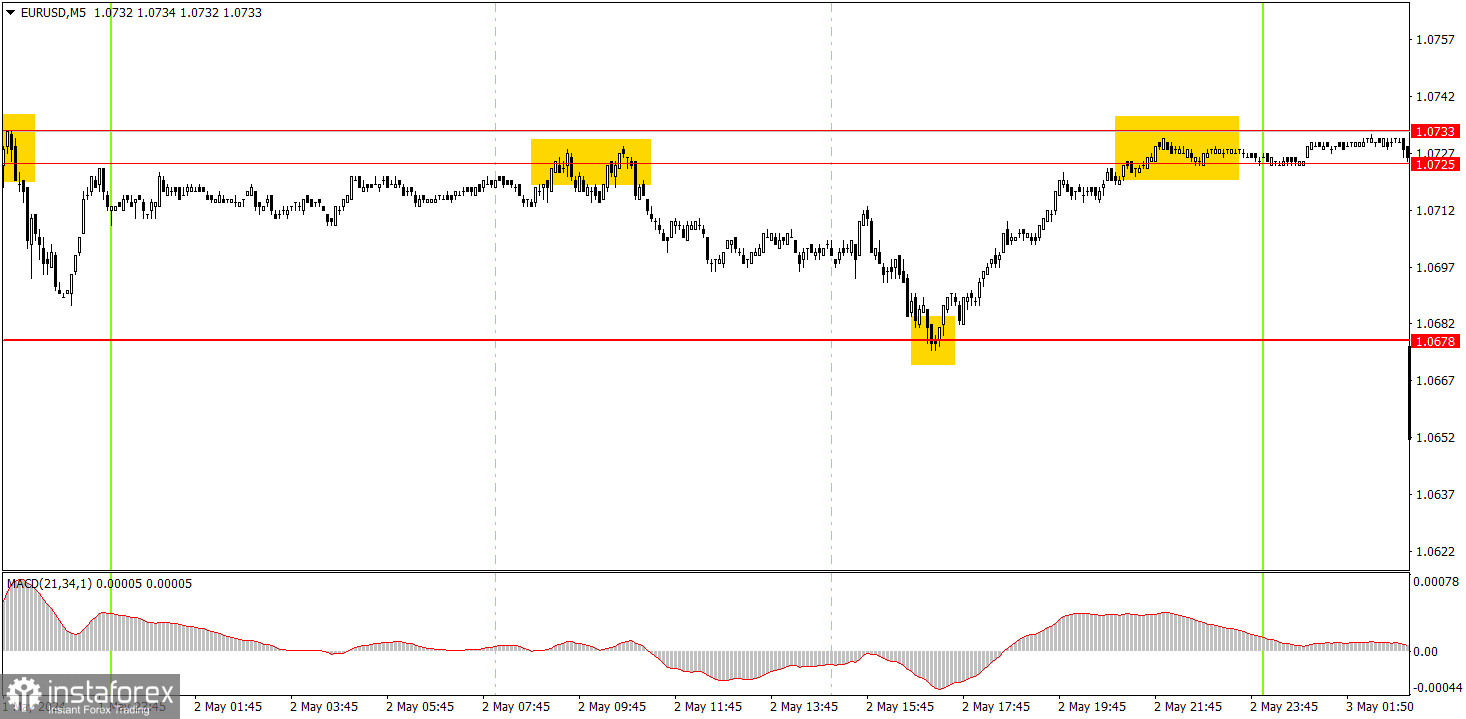
Volatility was weak on the 5-minute timeframe, but at the same time, the price almost perfectly reacted to technical levels. Initially, there were two rebounds from the area of 1.0725-1.0733, which should have been executed using a short position. Then the price dropped to the level of 1.0678 and bounced off it, so shorts should have been closed with a profit of about 25 pips and traders should have opened long positions. By the end of the day, the pair managed to return back to the area of 1.0725-1.0733, where longs could be closed. The profit amounted to another 25-30 pips. Overall, the day turned out to be quite profitable.
Trading tips on Friday:
On the hourly chart, the EUR/USD pair is going through a corrective phase. We believe that the decline should resume in the medium term, as the euro remains relatively high, and in general, the global trend is pointed downwards. The fundamental background still works in favor of the US dollar, and the latest FOMC meeting supports this - now Powell doesn't even know when monetary policy easing will begin.
Today, the pair may resume its decline, as the market had an illogical reaction to the FOMC meeting, and the price is now near the upper boundary of the sideways channel. Traders may consider trading from the area of 1.0725-1.0733. However, the US will release important data today, so the market reaction could be unpredictable.
The key levels on the 5M chart are 1.0483, 1.0526, 1.0568, 1.0611, 1.0678, 1.0725-1.0733, 1.0785-1.0797, 1.0838-1.0856, 1.0888-1.0896, 1.0940, 1.0971-1.0981. Today, the euro area unemployment data is scheduled for release, which traders may ignore. On the other hand, the US will publish crucial reports on NonFarm Payrolls, unemployment, and the ISM Non-Manufacturing PMI with wages. All these four reports can provoke a strong market reaction.
Basic trading rules:
1) Signal strength is determined by the time taken for its formation (either a bounce or level breach). A shorter formation time indicates a stronger signal.
2) If two or more trades around a certain level are initiated based on false signals, subsequent signals from that level should be disregarded.
3) In a flat market, any currency pair can produce multiple false signals or none at all. In any case, the flat trend is not the best condition for trading.
4) Trading activities are confined between the onset of the European session and mid-way through the U.S. session, after which all open trades should be manually closed.
5) On the 30-minute timeframe, trades based on MACD signals are only advisable amidst substantial volatility and an established trend, confirmed either by a trendline or trend channel.
6) If two levels lie closely together (ranging from 5 to 15 pips apart), they should be considered as a support or resistance zone.
How to read charts:
Support and Resistance price levels can serve as targets when buying or selling. You can place Take Profit levels near them.
Red lines represent channels or trend lines, depicting the current market trend and indicating the preferable trading direction.
The MACD(14,22,3) indicator, encompassing both the histogram and signal line, acts as an auxiliary tool and can also be used as a signal source.
Significant speeches and reports (always noted in the news calendar) can profoundly influence the price dynamics. Hence, trading during their release calls for heightened caution. It may be reasonable to exit the market to prevent abrupt price reversals against the prevailing trend.
Beginning traders should always remember that not every trade will yield profit. Establishing a clear strategy coupled with sound money management is the cornerstone of sustained trading success.