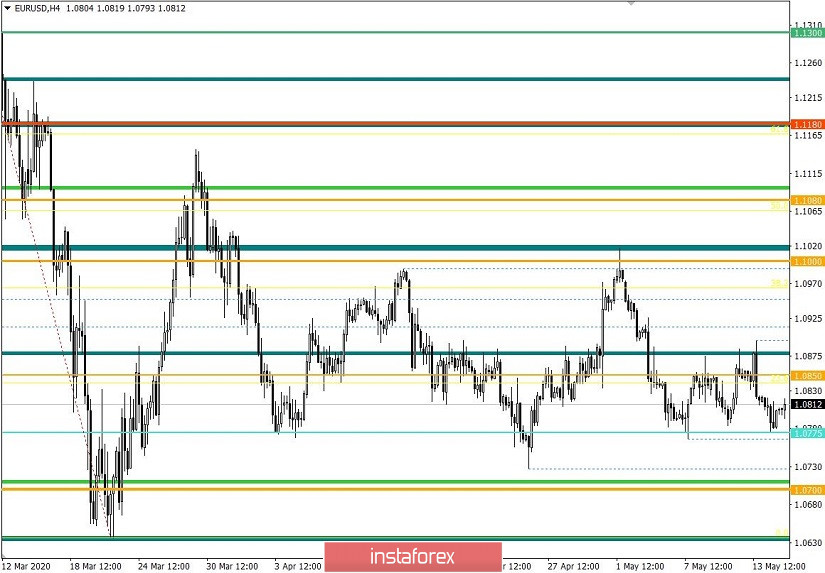
From the point of view of complex analysis, you can see another touch of the control level, and now about the details. The trading week is coming to an end, where you can confidently say that it was not boring. The quote tested the range level of 1.0775 twice, and also worked out the variable level of 1.0885 in a row, as a result, having a conditional recovery formation. The restraint of the downward mood speaks for itself, where the level of 1.0775, which focuses on itself trading forces, no longer seems impassable, and this is the third attempt to break it since the beginning of the month. Thus, the chance of further downward movement is high, and the level of 1.0775 will soon be broken.
Regarding the theory of downward development, which we have been adhering to for a long time, another proposition has appeared. So, an analysis was made of the comparison of the EUR/USD and GBP/USD currency pairs, where a positive correlation is known in history. The pound is now located near the control area of the interaction of trade forces 1.2150 / 1.2180, where in case of breakdown, the main downward movement can resume. In turn, the euro/dollar, as well as the pound/dollar, is at a critical level, which means the market direction is similar, where theoretically trading instruments can pull each other in a certain direction.
Analyzing the past trading day every minute, you can see a low activity, where the quote with surgical accuracy produced a level 1.0775, after which a pullback occurred.
As discussed in the previous review, the positions of traders were directed to the level of 1.0775, where the profit was taken. Further sales operations were planned after the price consolidated below 1.0760. Speculative operations on the rebound were also considered and may have been applied in the work of some traders.
In terms of volatility, the lowest indicator for 24 trading days was recorded and this is in some sense considered a signal of readiness of market participants for the subsequent acceleration. A similar pattern is found on the pound/dollar pair, where a slowdown was recorded relative to previous periods.
Considering the trading chart in general terms, the daily period, you can notice a sequence of descending paths that stretch from the month of March. At the same time, the last seven trading days had an increased concentration of trading forces between levels 1.0775//1.0850//1.0885, which indicated the process of accumulating short positions.
The news background of the past day had another data on the labor market in the United States, where the symmetry with the Great Depression is cited, only now. So the number of initial applications for unemployment benefits was 2,981,000, which in terms of statistics is considered the lowest figure for 8 weeks, but in terms of common sense, it is still a very high value. In turn, the number of repeat applications was 22 833 000, and this is a new record.
The market did not react to US statistics again, as it was in previous periods. The reason for the out of sync of fundamental analysis lies in the global risk caused by coronavirus.
In terms of the general informational background, one can see a surge of activity regarding the relationship between the United States and China, which is more like a reality show created in order to distract the public from the global problems caused by the coronavirus. So, at first, US President Donald Trump swore at Beijing that they did not provide timely information on the epidemiological situation and the spread of COVID-19. After which, Trump expressed dissatisfaction that China does not comply with the implementation standards of the 1st part of the trade agreement. Now, during the Fox Business Channel broadcast, Trump threatened to completely break off relations between the United States and China by playing in public, so to speak.
"We could do a lot of things. We could completely break the relationship. If you did this, what would happen? We would save $ 500 billion if we broke off completely," said Donald Trump.
The head of state also added that he did not want to talk with Chinese President Xi Jinping now, and repeated that he did not intend to resume negotiations on a trade deal with China.
Today, in terms of the economic calendar, they will publish the second estimate of European GDP, where the economic decline in the first quarter should be -3.3%. In the afternoon, the figures for retail sales in the United States will be published, where they expect a further decline from -8.4% to -12.0%. A little later, data on industrial production will come out, where the decline can accelerate from -5.5% to -16.4%.
Analyzing the current trading chart, you can see a variable price fluctuation in the range 1.0775 / 1.0820, where the quote is in the stage of conditional pullback from the level of 1.0775. In fact, the followers of the downward development are still at the lead, where the concentration of trading forces is going through the roof, otherwise the quote would have gone from a pullback to a correction. Our theory of the downward movement remains the main strategy for the future, and now the main goal is to breakdown the level of interaction of trade forces 1.0775. At the same time, we must make a profit on our trading deposit and not sit around constantly on the fence, waiting for the theory to be executed. Thus, the local position is valid and it is not necessary to exclude a more significant rebound from the level of 1.0775, as it was a period earlier.
The upcoming trading week in terms of the economic calendar contains a package of macroeconomic data in the European Union and the United States, where the quarantine measures introduced earlier are becoming more and more vivid in the economy.
The most interesting events displayed below --->
Tuesday, May 19
USA 12:30 Universal time - The volume of construction of new houses (April)
USA 12:30 Universal time - The number of construction permits issued (April)
Wednesday, May 20
EU 9:00 Universal time - Inflation
Thursday May 21
USA 12:30 Universal time - Applications for unemployment benefits
USA 13:45 Universal time - Index of business activity in the manufacturing sector (PMI) (May)
USA 13:45 Universal time - Business Activity Index (PMI) in the services sector (May)
USA 12:00 Universal time - Sales in the secondary housing market (Apr)
Friday May 22
EU 8:00 Universal time - Markit Manufacturing PMI (May) PRELIMINARY
EU 8:00 Universal time - Business activity index in the Markit services sector (May) PRELIMINARY
Further development
It can be assumed that the temporary fluctuation is within the range of 1.0775/1.0820, where the tactics of work will be both the breakdown method and the rebound, in the case of a more significant change.
Based on the above information, we derive trading recommendations:
- We consider selling positions lower than 1.0760, towards 1.0700.
- We consider buying positions in terms of local operations in consolidating prices higher than 1.0825, towards 1.0850.
Indicator analysis
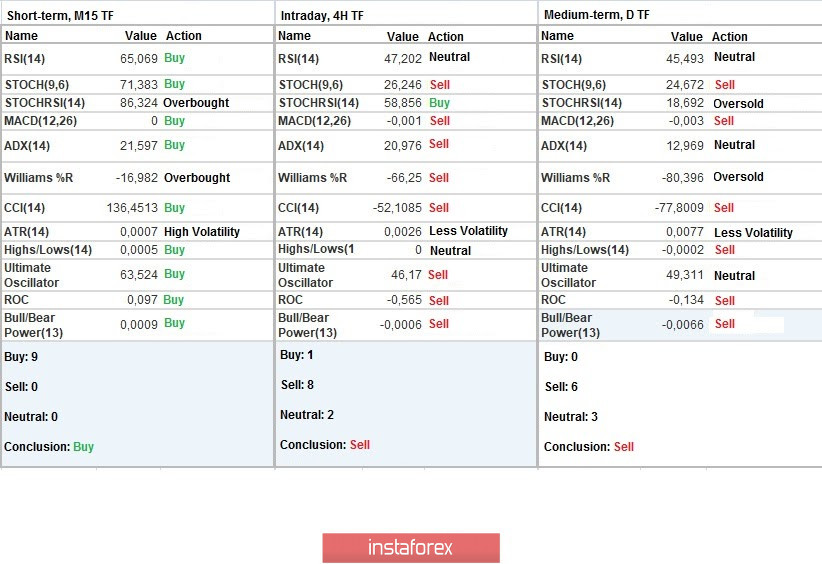
Analyzing a different sector of time frames (TF), we see that the indicators of technical tools are prone to sales on hourly and daily periods, but in case of delaying the existing pullback / stagnation process, I do not exclude that hourly intervals will change indicators locally.
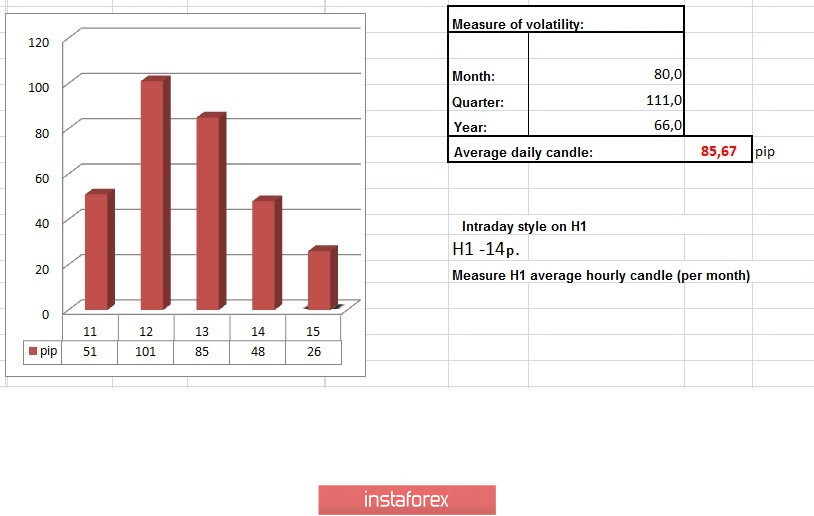
Volatility per week / Measurement of volatility: Month; Quarter; Year
Measurement of volatility reflects the average daily fluctuation calculated for Month / Quarter / Year.
(May 15 was built taking into account the time of publication of the article)
The volatility of the current time is 26 points, which is considered an extremely low indicator relative to the average daily value. It can be assumed that in case of breakdown of the main level, volatility will increase significantly.
Key levels
Resistance zones: 1.0850 **; 1.0885 *; 1,1000 ***; 1.1080 **; 1,1180; 1.1300; 1.1440; 1.1550; 1.1650 *; 1.1720 **; 1.1850 **; 1.2100
Support Areas: 1.0775 *; 1.0650 (1.0636); 1.0500 ***; 1.0350 **; 1.0000 ***.
* Periodic level
** Range Level
*** Psychological level