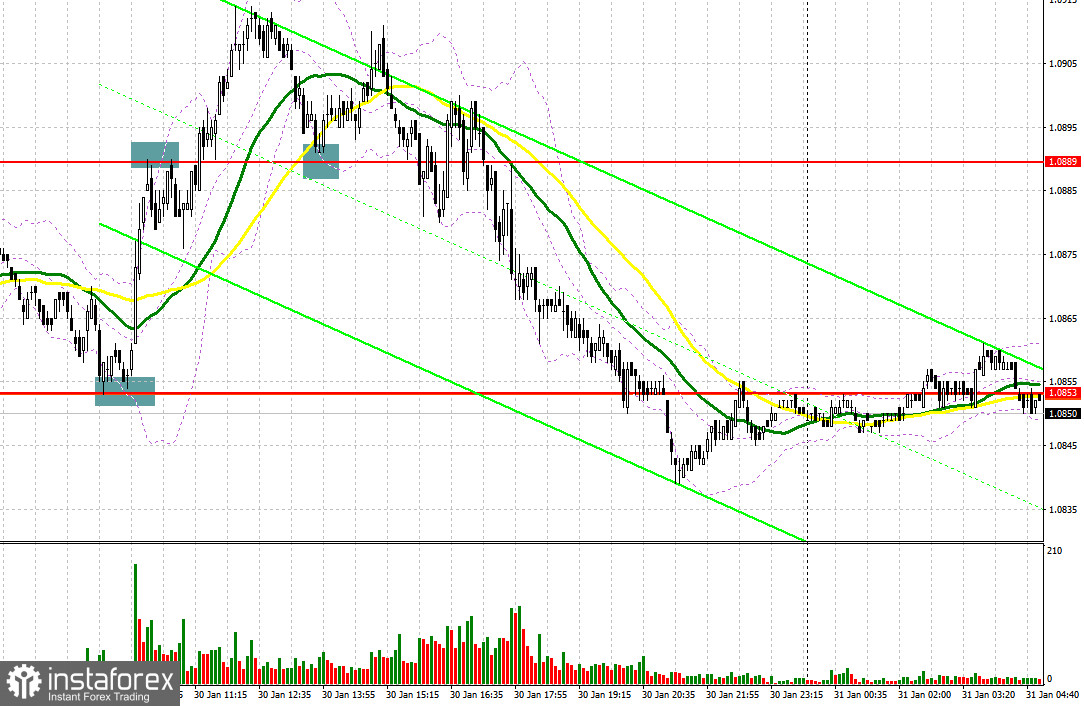
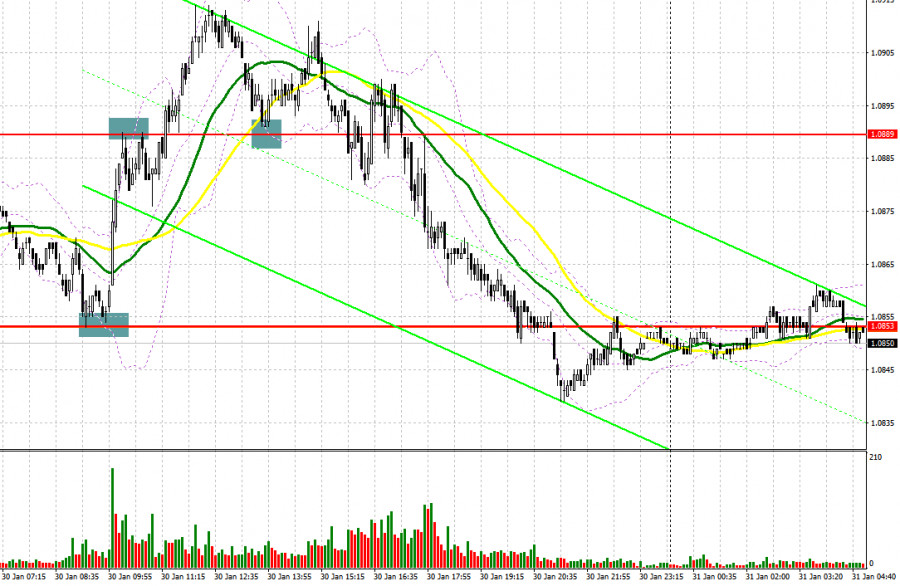
Yesterday, traders received several signals to enter the market. Let us take a look at the 5-minute chart to figure out what happened. Earlier, I asked you to focus on the level of 1.0853 to decide when to enter the market. The euro fell to 1.0853 amid the weak German data. After that, the pair formed a false breakout and a buy signal, which caused the euro to rally back to 1.0889, which made it possible to gain about 30 pips. A false breakout down at 1.0889 gave a sell signal, but the downside movement was only about 15 pips. In the afternoon, a breakout and the retest to 1.0889 gave a buy signal, but the bulls didn't reach the monthly highs. As a result, the upward movement was about 15 pips.
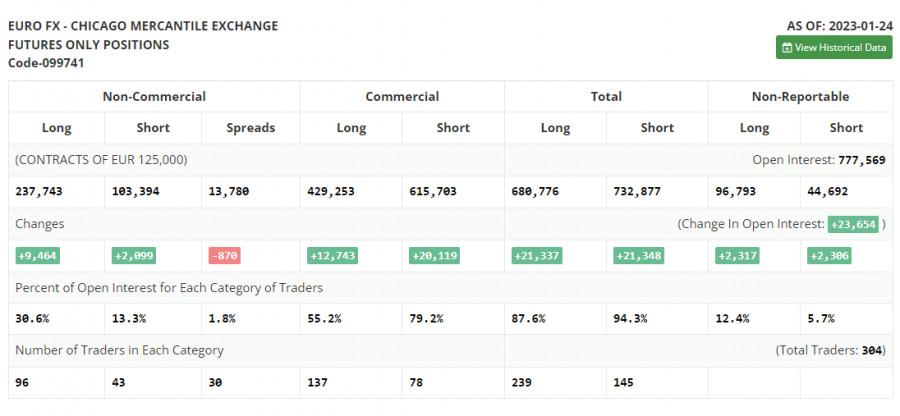
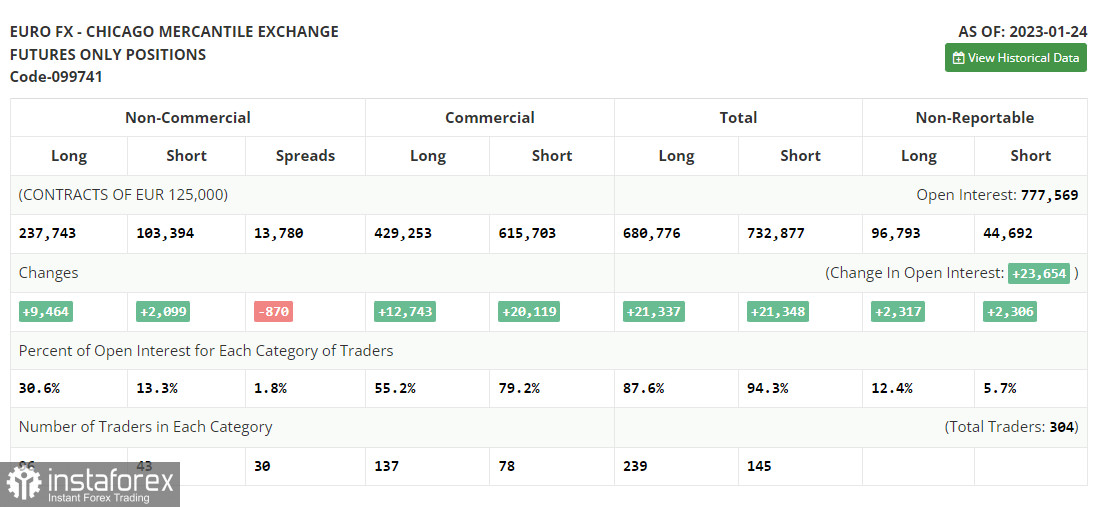
First of all, let us focus on the futures market and changes in the COT report. According to the COT report from January 24, the number of both long and short positions increased. Traders who were encouraged by the European Central Bank's officials last week continued to build up their long positions, as they expect aggressive moves from the central bank, as well as less aggressive policy from the Federal Reserve, which may revise the key interest rate hike. Quite weak fundamental data on the US economy, especially a decline in retail sales in December, points to how the overall situation is deteriorating in the country. It means that further monetary policy tightening may lead to even more negative results. Central bank meetings will take place this week, which will determine the pair's future direction. The COT report unveiled that the number of long non-commercial positions rose 9,464 to 237,743, while the number of short non-commercial positions jumped 2,099 to 103,394. At the end of the week, the total non-commercial net position was up 134,349 versus 126,984. All this suggests that investors believe in further growth in the euro but are still waiting for the central banks to paint a better picture on future interest rates. The weekly closing price rose to 1.0919 vs. 1.0833.
Conditions for opening long positions on EUR/USD:
Several data on eurozone countries will be released today, which may keep the bullish momentum had it not been for the Fed meeting. We will find out the results tomorrow, as well as gloomy forecasts on the growth rate of the European economy. We are expecting figures on the eurozone GDP growth rate for the fourth quarter of 2022. The same data from Germany turned out to be disappointing so we shouldn't expect anything good from the overall eurozone figure. German and Italian unemployment rates as well as consumer price indexes will probably take a back seat. Therefore, I expect a correction from the euro before tomorrow's Fed decision. In case the market reacts negatively to the decision, which is very likely, bulls should prevent the pair from going below the support at 1.0840, which was formed last week.
A false breakout at this level will trigger longs on the uptrend and encourage the rebound to 1.0873, and the bears' MAs are located there. A breakout and a downward test of this level will allow the pair to reach 1.0909, and give an additional buy signal with the target at 1.0956. The farthest target is located at a new monthly high of 1.1003. A breakout of this level may continue the bullish trend. It will be wise to lock in profits at this level. If the euro/dollar pair declines and bulls fail to protect 1.0840 during the European session, the euro may show a deeper correction. Only a false breakout of this level around the next support at 1.0806 will lead to a buy signal. It is also possible to go long just after a bounce off the low of 1.0770 or even lower – from 1.0735, expecting an upward correction of 30-35 pips within the day.
Conditions for opening short positions on EUR/USD:
The bulls did not even reach the monthly highs yesterday, which clearly shows that traders are cautious before the key central bank meetings. The bears have a good chance of entering a bearish correction, especially considering the data that will be released today. The main goal is to protect the resistance level of 1.0873, which was gained yesterday. A false breakout below this level after we receive disappointing eurozone data, which would take the euro to the lower limit of the sideways channel at 1.0840, would be the best time to sell. It is unlikely that there will be a serious struggle for it, because this level has been tested twice.
A breakout and settlement below this area as well as an upward test will give an additional sell signal. This will affect bulls' stop orders and push the pair to 1.0806, and will be the first correctional downward movement that may affect the bullish trend. Expect a move beyond that level only if we receive strong U.S. economic data in the afternoon. If the euro/dollar pair increases during the European session and bears fail to protect 1.0873, bulls will keep control over the market. In the event of this, traders should avoid selling the asset until the price hits 1.0909. A false breakout of this level will give a sell signal. Traders may also go short after a rebound from the high of 1.0956, or even higher - from 1.1003, expecting a decline of 30-35 pips.
Signals of indicators:
Moving Averages
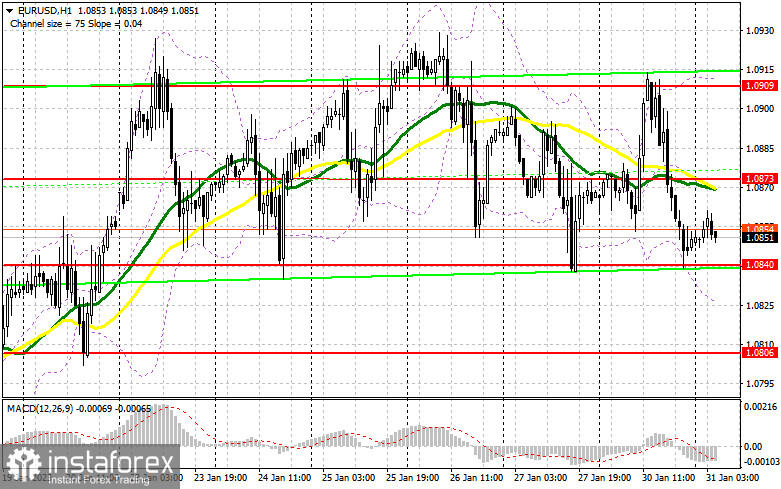
Trading is performed below the 30- and 50-day moving averages, which points to the possibility of entering a bearish correction.
Note: The author considers the period and prices of moving averages on the one-hour chart which differs from the general definition of the classic daily moving averages on the daily chart.
Bollinger Bands
In case the pair falls, the lower limit of the indicator located at 1.0820 will act as support. In case of growth, the upper limit of the indicator at 1.0910 will act as resistance.
Description of indicators
- Moving average (a moving average determines the current trend by smoothing volatility and noise). The period is 50. It is marked in yellow on the chart.
- Moving average (a moving average determines the current trend by smoothing volatility and noise). The period is 30. It is marked in green on the graph.
- MACD indicator (Moving Average Convergence/Divergence - convergence/divergence of moving averages). A fast EMA period is 12. A slow EMA period is 26. The SMA period is 9.
- Bollinger Bands. The period is 20.
- Non-profit speculative traders are individual traders, hedge funds, and large institutions that use the futures market for speculative purposes and meet certain requirements.
- Long non-commercial positions are the total number of long positions opened by non-commercial traders.
- Short non-commercial positions are the total number of short positions opened by non-commercial traders.
- The total non-commercial net position is a difference in the number of short and long positions opened by non-commercial traders.