empty
 
 
27.03.2024 03:03 PM
GBP/USD: trading scenarios on March 27, 2024

This image is no longer relevant

The results of the Bank of England's March meeting and comments from its leaders exerted pressure on the pound and the GBP/USD pair.

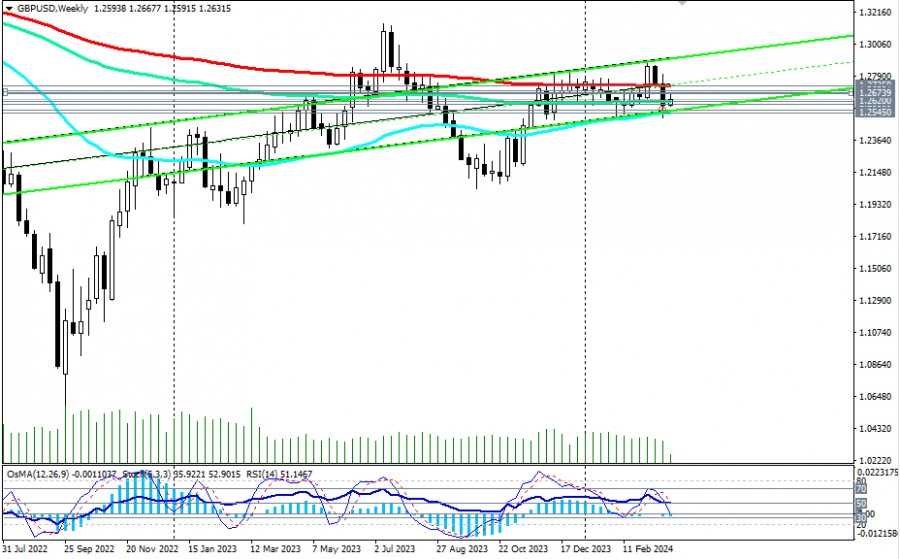
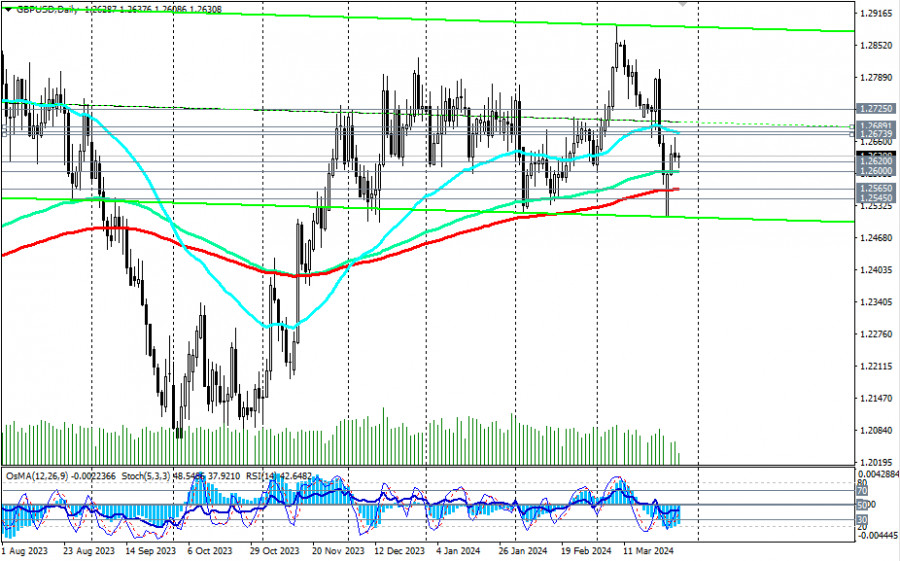
The next day, the pair tested key support levels for a breakthrough: 1.2565 (200 EMA on the daily chart) and 1.2545 (50 EMA on the weekly chart), separating the medium-term bullish market from the bearish one.

This image is no longer relevant

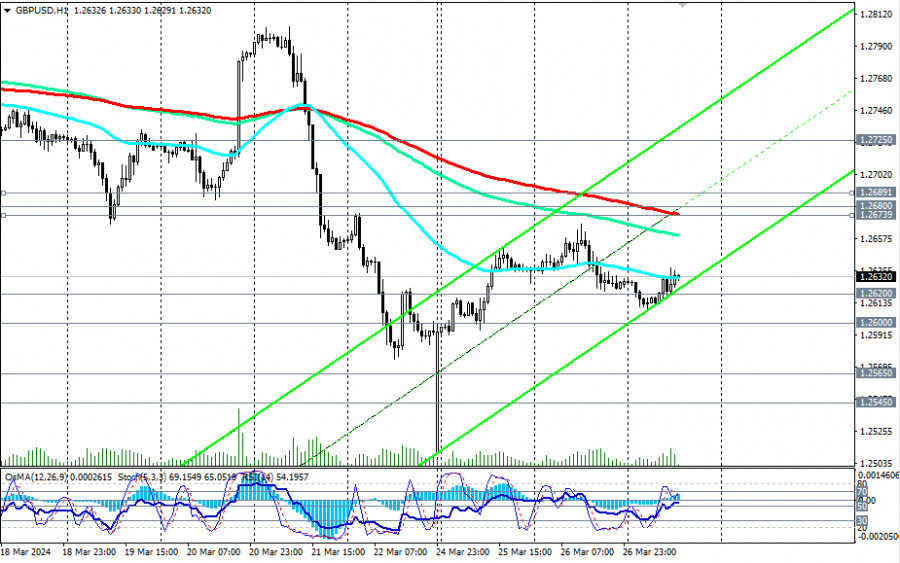
Subsequently, GBP/USD managed to recover somewhat, rising from a local low of 1.2510 to the resistance zone at levels 1.2674 (200 EMA on the 1-hour chart), 1.2680 (50 EMA on the daily chart), and 1.2689 (200 EMA on the 4-hour chart).

However, the corrective potential dried up near the 1.2667 mark, and GBP/USD resumed its decline.

This image is no longer relevant

Thus, as of this writing, it was trading near the 1.2632 mark, declining towards the important support level of 1.2600 (144 EMA on the daily chart).

At the same time, technical indicators such as OsMA, RSI, and Stochastic on the daily and weekly charts are favoring sellers, signaling the advantage of short positions.

A breakout below the key support level of 1.2600 could be the first signal for new medium-term short positions, with the breakout of key support levels of 1.2565 and 1.2545 confirming this.

Moreover, below the key resistance level of 1.2725, GBP/USD is in the long-term bearish market zone, giving preference to long-term short positions.

In an alternative scenario, if GBP/USD resumes its rise, it will again head towards the resistance zone near levels 1.2674, 1.2680, and 1.2690. Their breakout could trigger further growth towards the key resistance level of 1.2725. Its breakout, in turn, will lead the pair into the long-term bullish market zone, which would be the first signal for long-term long positions.

For now, the advantage lies with the shorts.

Support levels: 1.2600, 1.25656, 1.2545, 1.2500

Resistance levels: 1.2674, 1.2680, 1.2689, 1.2700, 1.2725, 1.2800, 1.2830, 1.2860, 1.2890, 1.2900, 1.3000, 1.3100, 1.3140

Trading Scenarios:

Main scenario: Sell Stop 1.2590. Stop-Loss 1.2655. Targets 1.25656, 1.2545, 1.2500

Alternative scenario: Buy Stop 1.2655. Stop-Loss 1.2590. Targets 1.2674, 1.2680, 1.2689, 1.2700, 1.2725, 1.2800, 1.2830, 1.2860, 1.2890, 1.2900, 1.3000, 1.3100, 1.3140

"Targets" correspond to support/resistance levels. This also does not mean that they will necessarily be reached, but they can serve as a guide when planning and placing trading positions.

Jana pendapatan melalui perubahan kadar mata wang kripto dengan InstaForex.
Muat turun MetaTrader 4 dan buka dagangan pertama anda.
  • Grand Choice
    Contest by
    InstaForex
    InstaForex always strives to help you
    fulfill your biggest dreams.
    SERTAI PERADUAN
  • Chancy Deposit
    Deposit akaun anda sebanyak $3,000 dan dapatkan $9000 lebih lagi!
    Dalam Mei kami membuat cabutan bertuah $9000 dalam Kempen Chancy Deposit!
    Dapatkan peluang untuk menang dengan membuat deposit $ 3000 ke dalam akaun dagangan. Setelah memenuhi syarat ini, anda menjadi peserta kempen.
    SERTAI PERADUAN
  • Trade Wise, Win Device
    Daftar untuk peraduan dan tambah dana akaun anda dengan sekurang-kurangnya AS$ 500 untuk layak memenangi peranti mudah alih.
    SERTAI PERADUAN
  • Bonus 100%
    Peluang istimewa anda untuk menerima bonus 100% pada deposit anda
    DAPATKAN BONUS
  • Bonus 55%
    Dapatkan bonus 55% pada setiap deposit anda
    DAPATKAN BONUS
  • Bonus 30%
    Dapatkan bonus 30% setiap kali anda membuat penambahan dana akaun anda
    DAPATKAN BONUS

Artikel yang dicadangkan

Tidak boleh bertanya sekarang?
Tanya soalan anda di Ruangan bersembang.
Panggilan semula Widget