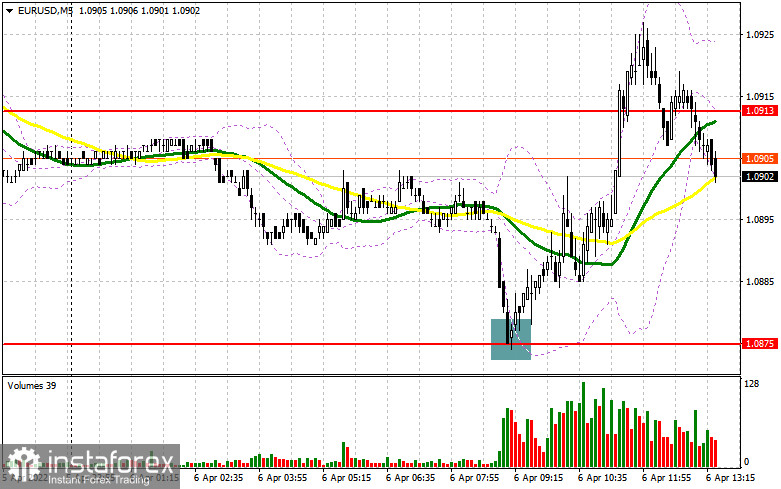
In the morning article, I highlighted the level of 1.0875 and recommended taking decisions with this level in focus. Now let's look at the 5-minute chart and try to figure out what actually has happened. Data on Germany's factory orders turned out to be quite positive. It triggered a sharp drop in the euro at the very beginning of European trading. Bulls managed to undertake a false breakout of the level of 1.0875. It gave a buy signal for EUR/USD. The pair added more than 50 pips. However, it was unable to consolidate at the resistance level of 1.0915 in the first half of the day. At the time of writing this article, the pair declined below this level. Therefore, I had to revise the technical outlook for the pair.
What is needed to open long positions on EUR/USD
The US session is likely to be quite volatile as traders will finally get the chance to study the FOMC meeting minutes for March. Traders hope to find statements about a faster-than-expected monetary policy tightening and plans to curb rising inflation. Notably, inflation in the US has already approached the highest level in four decades. Last week, many Fed policymakers repeatedly outlined the need for a more aversive rate hike at the May meeting. Naturally, it led to the emerging bearish trend for EUR/USD. Analysts believe that it will continue in the near future. Its trajectory may be somehow altered by the release of the FOMC minutes. However, it may happen only if traders do not find answers to their questions in the minutes. As I have mentioned above, the technical outlook has changed. Now, the bulls need to slow down the bearish trend. To do so, they should push the price above the 1.0925 level. Only a downward test of this level and dovish statements by FOMC member Patrick T. Harker and Treasury Secretary Janet Yellen may provide the first buy signal for the euro. If so, the euro may start an upward correction to a large resistance of 1.0970. I recommend profit-taking at this level. It is too early to talk about a larger upward reversal of the pair due to geopolitical tension. The next target level will be 1.1007. If the euro declines again and bearish activity is high during the American session, I advise you to wait for a false breakout of 1.0875. The similar example I presented above. The euro will hardly climb higher if there is no positive geopolitical news. If bulls show no energy at 1.0875, it is better to cancel long positions. It is recommended to open longs positions after a false breakout of a low located at 1.0843. It is also possible to buy the euro immediately on a rebound from 1.0810 or even a lower low around 1.0772, keeping in mind an upward intraday correction of 30-35 pips.
What is needed to open short positions on EUR/USD
Bears tried to take control but the euro was too oversold. I talked about it in detail in my morning forecast. Ukraine is delating the negotiations. There is also no positive news on Russia's special military operation. It has a negative impact on market sentiment. It also extorted pressure on the euro even despite the upward correction. However, a correction is necessary taking into account the current situation. Bears were able to push the price to the weekly lows in the first half of the day. So, their primary task for the American session will be to protect the new resistance level of 1.0925. Moving averages are passing in the negative territory at this level. The trajectory of the pair will also depend on the statements of Fed policymakers and the Treasury Secretary. Bears also need to defend 1.0925. A false breakout of this level will give a sell signal euro within the trend. In this case, the target level will be the support level of 1.0875. A breakout and an upward test of this level could undermine bulls' stop orders. As a result, the pair may dip to the lows of 1.0875 and 1.0843. I recommend profit-taking at this level. A more distant target will be the 1.0810 level. If the euro rises and bears show no activity at 1.0925, do not panic. Just postpone sales until a larger resistance level of 1.0970. You need to look for a rebound after the first breakout It is better to open short positions when the price reaches a high of 1.1007. Keep in mind an intraday downward correction of 25-30 pips.
COT report
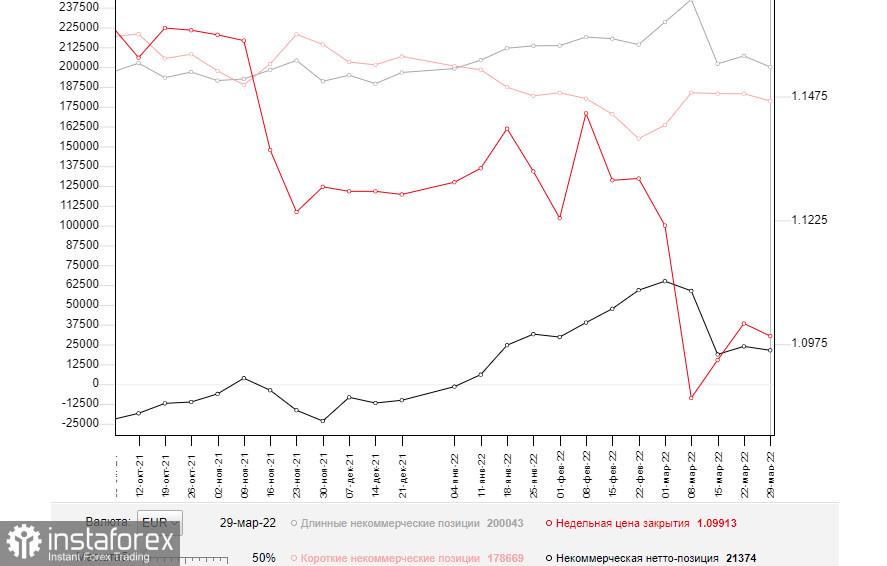
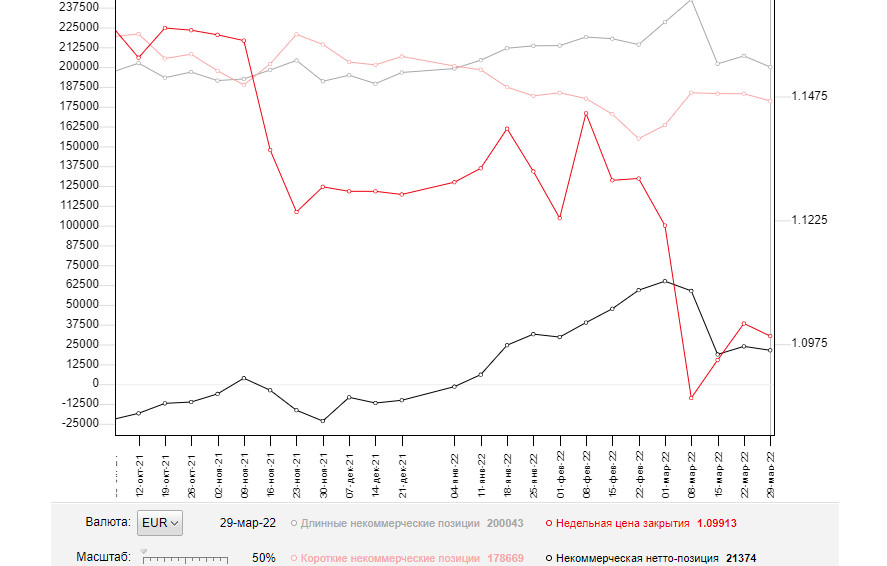
The COT report for Marc 29 logged a drop in short positions and long ones. Notably, the number of buyers who left the market exceeded the number of sellers. It indicates pessimism among market participants caused by the current geopolitical situation. Meanwhile, the risk of higher inflation in the eurozone is the key issue for the ECB. Inflation has already jumped to 7.5%. Last week, Christine Lagarde emphasized several times the regulator's intention to switch to a more aggressive approach to the QE tapering and key interest rate hike. The euro has a good mid-term prospect for growth amid such statements. It is already significantly oversold against the US dollar. However, the lack of positive shifts in the negotiations between Russia and Ukraine and growing geopolitical tensions have a negative impact on the euro. Economic problems in the eurozone triggered by extremely high inflation and responsive measures taken by Russia (including payments for gas in rubles) are likely to continue exerting pressure on the euro in the short term. That is why the pair is unlikely to advance in the near future. The COT report revealed that the number of long non-commercial positions declined to 200,043 from 207,051. At the same time, the number of short non-commercial positions decreased to 178,669 from 183,208. Since a drop in the number of short positions turned out to be more significant, the overall non-commercial net position slid down to 21,374 from 23,843. The weekly close price also tumbled to 1.0991 from 1.1016.
Signals of technical indicators
Moving averages
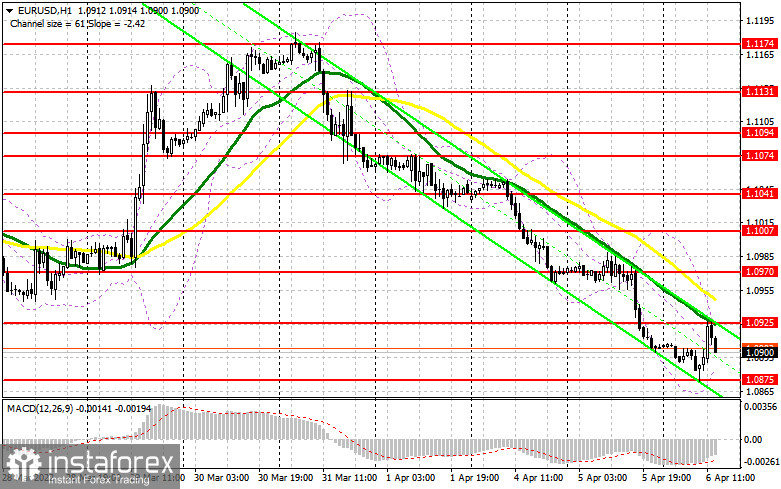
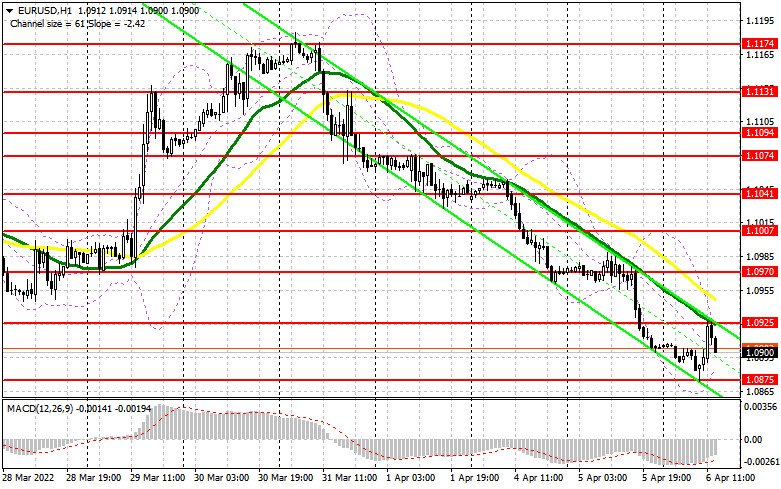
EUR/USD is trading below 30- and 50-period moving averages. It means that the euro is likely to continue its downward movement.
Remark. The author is analyzing a period and prices of moving averages on the 1-hour chart. So, it differs from the common definition of classic daily moving averages on the daily chart.
Bollinger Bands
In case of a rise, the 1.0925 level will act as resistance.
Definitions of technical indicators
- Moving average recognizes an ongoing trend through leveling out volatility and market noise. A 50-period moving average is plotted yellow on the chart.
- Moving average identifies an ongoing trend through leveling out volatility and market noise. A 30-period moving average is displayed as the green line.
- MACD indicator represents a relationship between two moving averages that is a ratio of Moving Average Convergence/Divergence. The MACD is calculated by subtracting the 26-period Exponential Moving Average (EMA) from the 12-period EMA. A 9-day EMA of the MACD called the "signal line".
- Bollinger Bands is a momentum indicator. The upper and lower bands are typically 2 standard deviations +/- from a 20-day simple moving average.
- Non-commercial traders - speculators such as retail traders, hedge funds and large institutions who use the futures market for speculative purposes and meet certain requirements.
- Non-commercial long positions represent the total long open position of non-commercial traders.
- Non-commercial short positions represent the total short open position of non-commercial traders.
- The overall non-commercial net position balance is the difference between short and long positions of non-commercial traders.