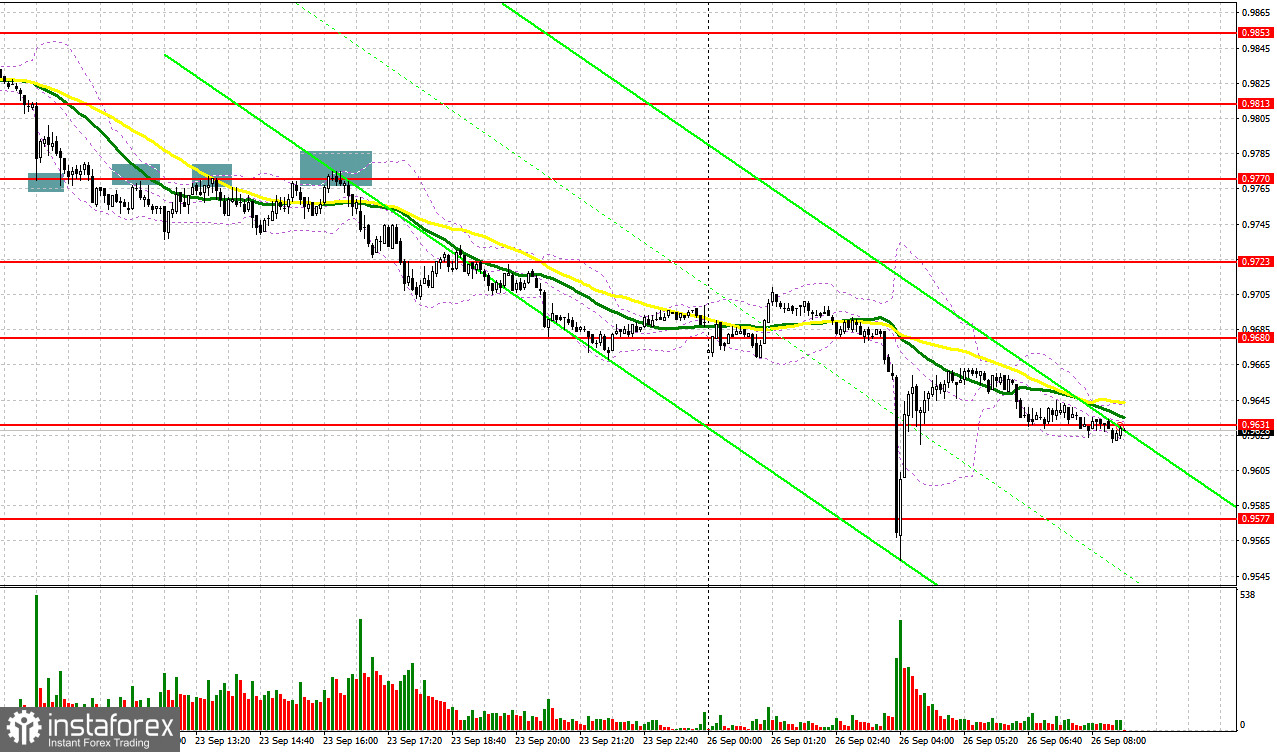
On Friday, there were several excellent entry points, which helped traders to make a profit. Now, let's look at the 5-minute chart and try to figure out what actually happened. In the morning article, I turned your attention to the levels of 0.9813 and 0.9770 and recommended taking decisions with this level in focus. A breakout of 0.9813 following dismal macro stats from the eurozone gave a sell signal. EUR/USD dropped to a low of 0.9770. The bulls tried to defend this level with a false breakout and a new signal. The pair failed to start an upward movement after a 15 pip correction. So, the pressure on the pair returned. A breakout of 0.9770 and an upward test provided another sell signal. The price declined by 35 pips. During the second half of the day, bears defended the resistance level of 0.9770 several more times. Each time the pair lost 35-40 pips. After another false breakout of 0.9770, the euro plummeted by 90 pips.
Conditions for opening long positions on EUR/USD:
Hawkish comments of Fed Chair Jerome Powell which he made last week only bolstered demand for the greenback. Given the escalating geopolitical tensions, the US dollar is sure to rise higher as a safe-haven asset. Therefore, the euro may face bearish pressure once again in the near future. It is crucial to find the correct entry points into short positions and continue to sell the pair. Today, Germany is going to unveil a batch of fresh economic reports. However, analysts believe the figures could be weak. If so, it will be another signal to increase short positions. Investors are highly anticipating the Ifo Business Climate Index. ECB President Christine Lagarde is also going to give a speech today. However, her remarks may push the euro lower. If bears escalate pressure on the pair, I advise you to refrain from opening long positions. Only a false breakout of 0.9605 will give a new buy signal. The target level of the upward correction is located at 0.9655. It was formed at the end of the Asian session. A breakout and a downward test of this level, as well as upbeat reports for Germany, may force bears to close their Stop Loss orders, giving an additional buy signal. If so, the price could touch 0.9707 where the moving averages are passing in negative territory. A more distant target will be the resistance level of 0.9770 where I recommend locking profits. If EUR/USD declines, which is more likely, and bulls show no activity at 0.9605, the pressure on the pair will increase. Hence, the bearish trend is likely to persist. The optimal solution for opening long positions will be a false breakout of a low of 0.9558. You can buy EUR/USD immediately at a bounce from 0.9509 or 0.9458, keeping in mind an upward intraday correction of 30-35 pips.
Conditions for opening short positions on EUR/USD:
The bears are now in control. However, they may partially leave the market after another sell-off in the Asian session. Given that speculators are unwilling to buy risky assets, a further decline in the pair looks likely. It is better to sell the euro after a rise to 0.9655 in the afternoon and a false breakout there. If Germany reveals downbeat data, bears will again resume the upper hand. The pair could decrease to a low of 0.9605. A drop below this level and an upward test will provide an additional sell signal. Bulls will be forced to close Stop Loss orders. So, the pair may drift lower to 0.9558. A more distant target will be the 0.9509 level where I recommend locking in profits. If EUR/USD rises during the European session and bears show no energy at 0.9655, the euro is likely to rebound, entering the sideways channel. However, it will hardly undermine the bearish bias. An upward correction could push the pair to the next resistance level of 0.9707 where the moving averages are passing in negative territory. I recommend opening short positions only after a false breakout occurs. You can sell EUR/USD immediately at a bounce from a high of 0.9770 or 0.9813, keeping in mind a downward intraday correction of 30-35 pips.
COT report
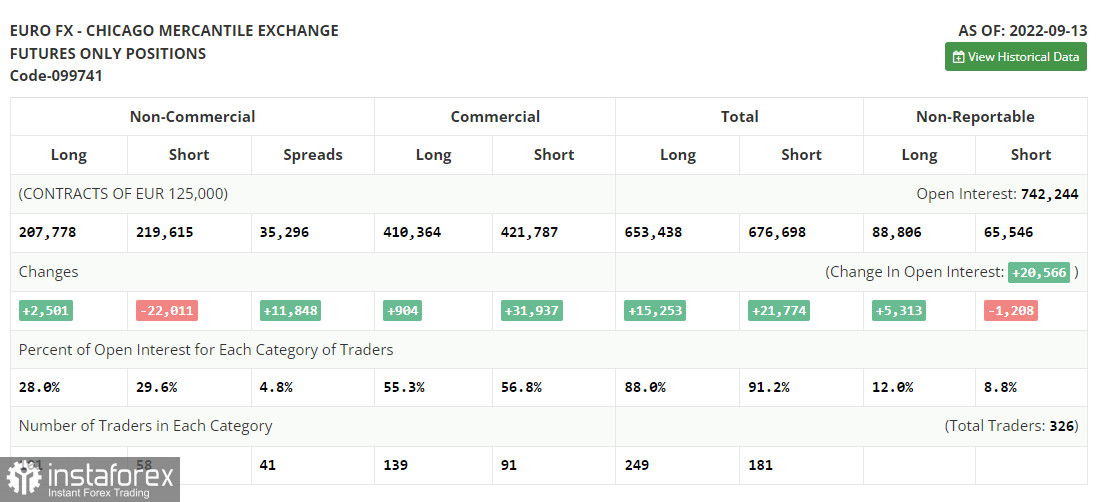
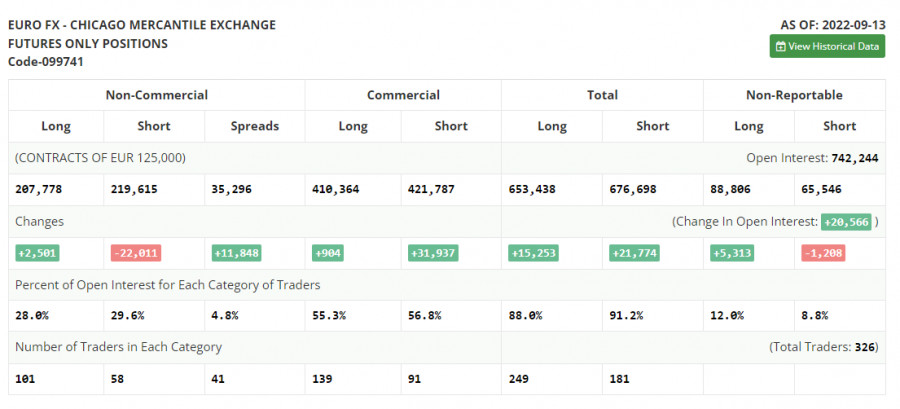
The COT report (Commitment of Traders) for September 13 logged a drop in the number of short positions and a slight increase in the number of long ones. Apparently, traders decided to lock in profits following the ECB meeting and a sharp interest rate increase of 0.75% even despite the approaching FOMC meeting. The Fed will probably raise the key rate by at least 0.75%. However, there are rumors that the central bank could hike the key rate by 100 basis points. If so, bears are sure to take the upper hand. The euro could drop to new lows. Given the US inflation report for August, such a scenario looks feasible. However, the European Central Bank is also no longer sitting on the sidelines. It also moved to aggressive tightening, narrowing the rate gap. This is good news for long-term traders, betting on a rise in risk assets. The COT report reveals that the number of long non-commercial positions jumped by 2,501 to 207,778, while the number of short non-commercial positions tumbled by 22,011 to 219,615. At the end of the week, the total non-commercial net position remained negative but rose slightly to -11,832 from -36,349. It indicates the continuation of the upward correction and an attempt to hit the bottom. The weekly closing price advanced to 0.9980 against 0.9917.
Signals of technical indicators
Moving averages
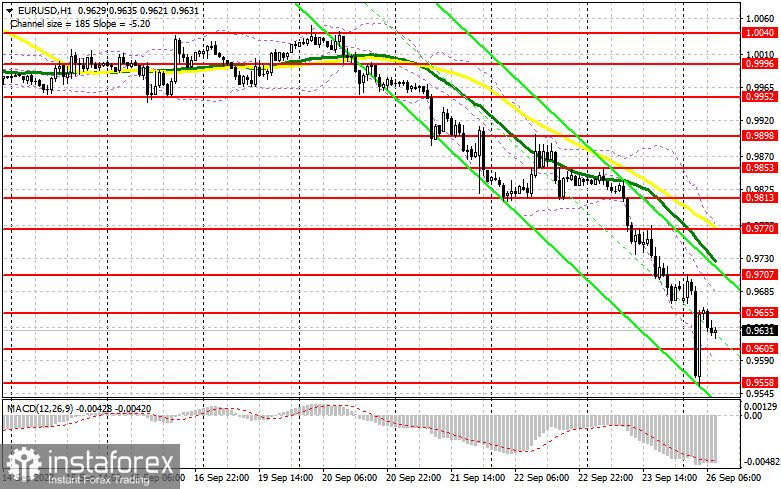
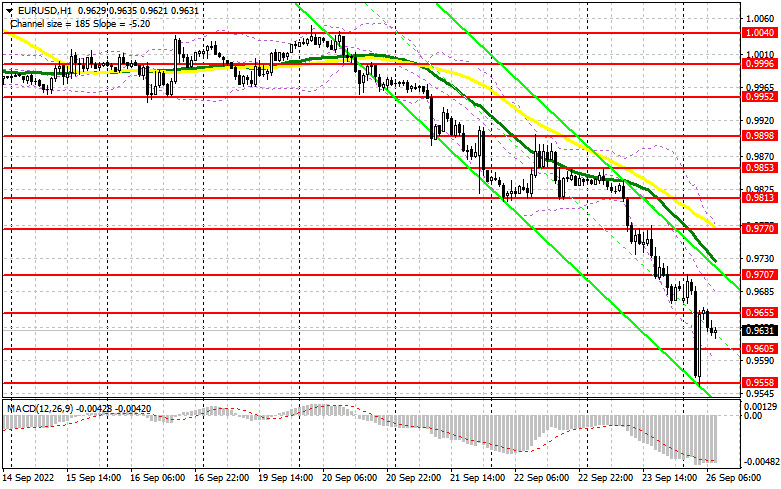
EUR/USD is trading slightly below 30- and 50-period moving averages. It means that bears are in control.
Remark. The author is analyzing the period and prices of moving averages on the 1-hour chart. So, it differs from the common definition of classic daily moving averages on the daily chart.
Bollinger Bands
If the EUR/USD pair climbs, the indicator's upper border at 0.9770 will act as resistance.
Definitions of technical indicators
- Moving average recognizes an ongoing trend through leveling out volatility and market noise. A 50-period moving average is plotted yellow on the chart.
- Moving average identifies an ongoing trend through leveling out volatility and market noise. A 30-period moving average is displayed as the green line.
- MACD indicator represents a relationship between two moving averages that is a ratio of Moving Average Convergence/Divergence. The MACD is calculated by subtracting the 26-period Exponential Moving Average (EMA) from the 12-period EMA. A 9-day EMA of the MACD called the "signal line".
- Bollinger Bands is a momentum indicator. The upper and lower bands are typically 2 standard deviations +/- from a 20-day simple moving average.
- Non-commercial traders - speculators such as retail traders, hedge funds, and large institutions who use the futures market for speculative purposes and meet certain requirements.
- Non-commercial long positions represent the total long open position of non-commercial traders.
- Non-commercial short positions represent the total short open position of non-commercial traders.
- The overall non-commercial net position balance is the difference between short and long positions of non-commercial traders.