Analysis of EUR/USD 5M.
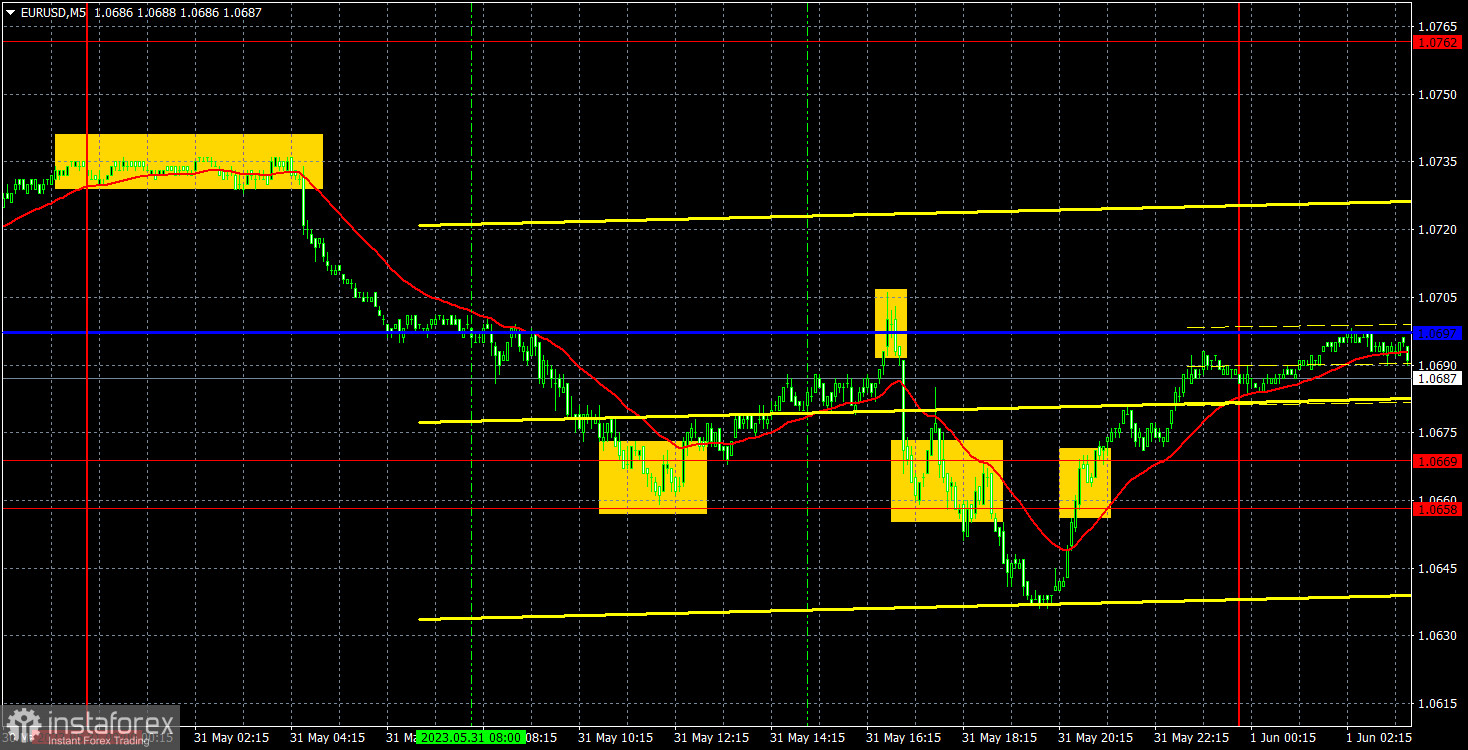
The EUR/USD pair fell lower on Wednesday. It decreases every day. Sometimes it tumbles by 20 pips, sometimes it drops steeper. For example, yesterday there were at least three events that increased pressure on the euro and facilitated a rise in the US dollar. At night, Cleveland Fed President Loretta Meister made a speech. She spoke in favor of a new rate hike in June. There were also lots of economic reports from EU countries. They all showed a significant slowdown in consumer prices. The US revealed job openings data for April. The figure turned out to be much better than the forecast. Therefore, the fall of the pair was quite predictable.
There were several trading signals. The pair bounced from 1.0658-1.0669 and rose to the pivot level. For long positions, it was possible to earn about 10 pips as the upward movement was weak. A rebound from the pivot level gave entry points into short positions. The price fell below 1.0658-1.0669 where it was necessary to close trades manually as it was in the evening. The profit from this trade was about 30-40 pips. The last buy signal occured too late. So, I did not pay attention to it. In general, trading on Wednesday turned out to be profitable.
COT report:
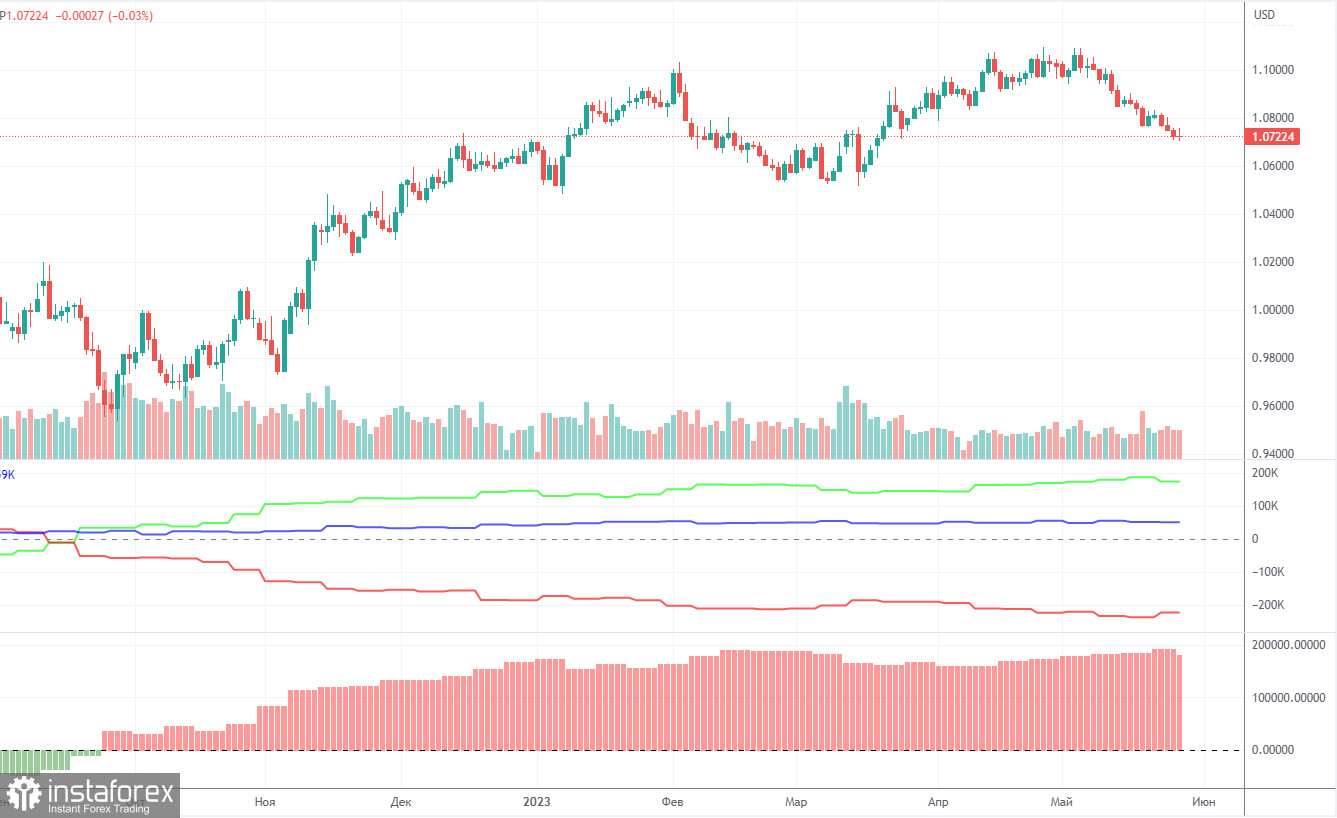
On Friday, a new COT report for May 23 was released. In the last 9 months, COT reports have fully corresponded to what is happening on the market. The chart above clearly shows that the net position of large traders (the second indicator) began to grow in September 2022. At about the same time, the euro rose as well. At the moment, the net position of non-commercial traders is bullish. They increase their long positions. So, the euro is growing too.
Notably, we may assume by the extremely bullish net position that the uptrend may soon stop. The first indicator signals such a possibility and the red and green lines are far away from each other, which is usually a sign that the end of the trend might be nearing. The euro attempted to go down several months ago, but those were just minor pullbacks. In the reporting week, long positions of non-commercial traders decreased by 8,600 and short positions rose by 4,700. The net position dropped by 13,300. The number of long positions exceeds that of short ones by 174,000, a rather big gap. A correction or a new downtrend has started. So, it is clear that the pair will be bearish even without COT reports.
Analysis of EUR/USD 1H.
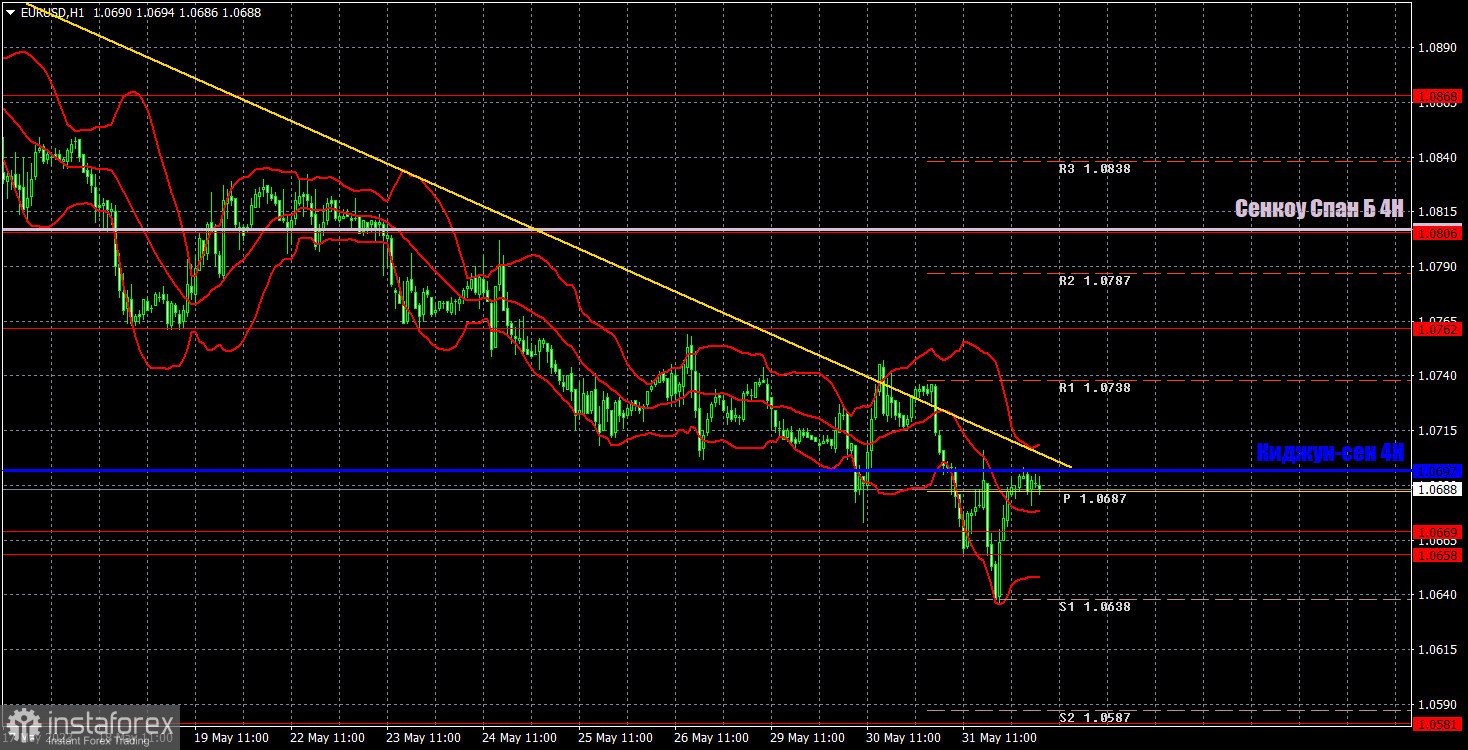
On the 1-hour chart, the pair is still moving down. The trend is strong. The trendline is relevant. The pair decreases every day. However, the downward movement is weak. It is difficult to make a profit on smaller charts. Yesterday, volatility increased. In the remaining two days of the week, it may be high due to the release of crucial macroeconomic reports.
On June 1, traders should pay attention to the following levels: 1.0537, 1.0581, 1.0658-1.0669, 1.0762, 1.0806, 1.0868, 1.0943, 1.1092 as well as the Senkou Span B (1.0807) and Kijun-sen (1.0697) lines. Ichimoku indicator lines can move intraday, which should be taken into account when determining trading signals. There are also support and resistance although no signals are made near these levels. Signals could be made when the price either breaks or bounces from these extreme levels. Do not forget to place Stop Loss at the breakeven point when the price goes by 15 pips in the right direction. In case of a false breakout, it could save you from possible losses.
ECB President Christine Lagarde will make a speech today. The EU will also unveil its inflation figures. The US will reveal initial jobless claims, the ADP report, and the ISM Manufacturing Index. There will be a lot of important events. Therefore, volatility may be high. The pair could also show several reversals during the day.
Indicators on charts:
Resistance/support - thick red lines, near which the trend may stop. They do not make trading signals.
Kijun-sen and Senkou Span B are the Ichimoku indicator lines moved to the hourly timeframe from the 4-hour timeframe. They are also strong lines.
Extreme levels are thin red lines, from which the price used to bounce earlier. They can produce trading signals.
Yellow lines are trend lines, trend channels, and other technical patterns.
Indicator 1 on the COT chart is the size of the net position of each trader category.
Indicator 2 on the COT chart is the size of the net position for the Non-commercial group of traders.