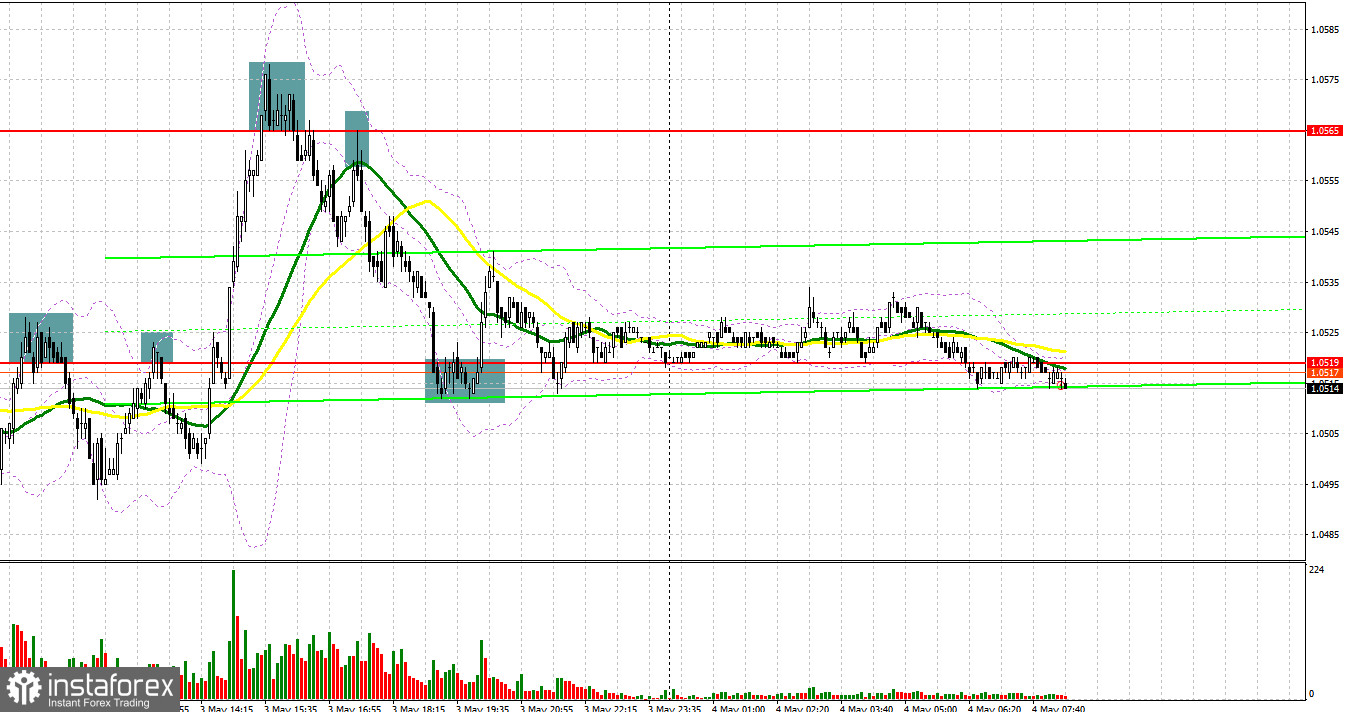
Yesterday, traders received numerous signals to enter the market. Let us focus on the 5-minute chart to clear up the market situation. Earlier, I asked you to pay attention to the level of 1.0519 to decide when to enter the market. An unsuccessful attempt to rise took place after the publication of the eurozone data. After that, the pair showed a false break of 1.0519, thus causing a sell signal. As a result, the pair lost 25 pips. Next, the price hit a new daily low and returned to 1.0519 to form a similar false break. Traders received a sell signal, but the pair dropped only by 20 pips. In the second part of the day after a jump to 1.0565, bears managed to protect this level, providing traders with a signal to enter the market. After that, the pair settled below 1.0565 and upwardly tested this level, giving traders an additional sell signal, which brought 45 pips. A drop to 1.0519 and an unsuccessful attempt to move lower led to a buy signal. As a result, the pair climbed by 25 pips.
Conditions for opening long positions on EUR/USD:
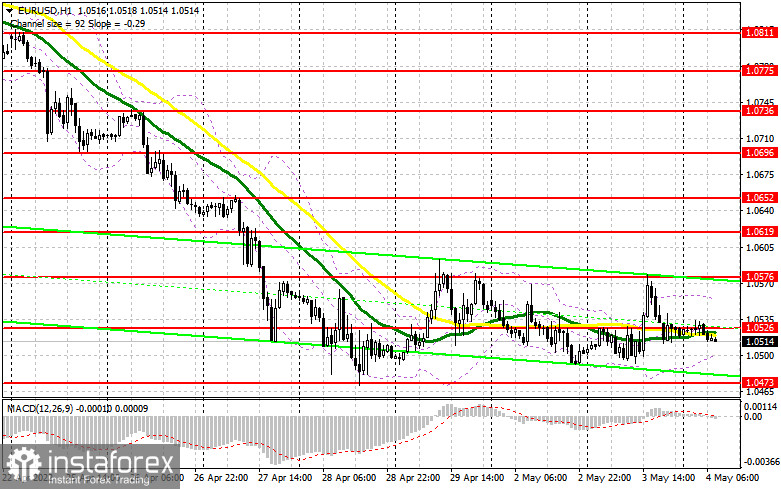
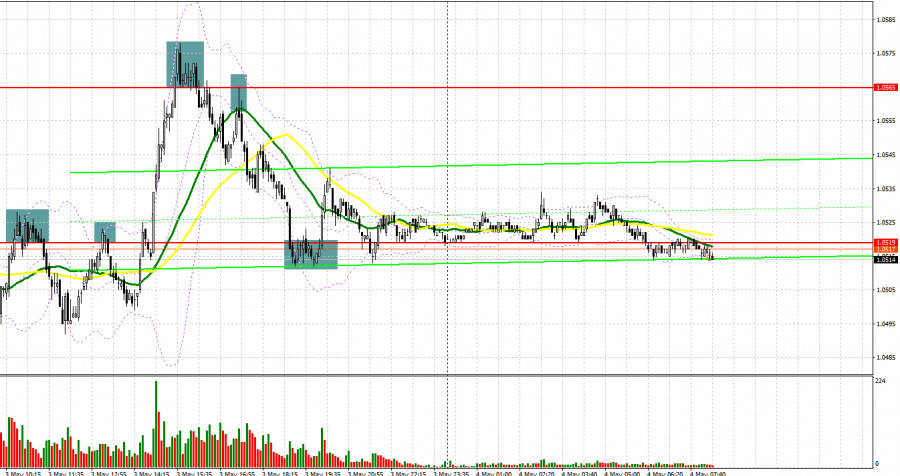
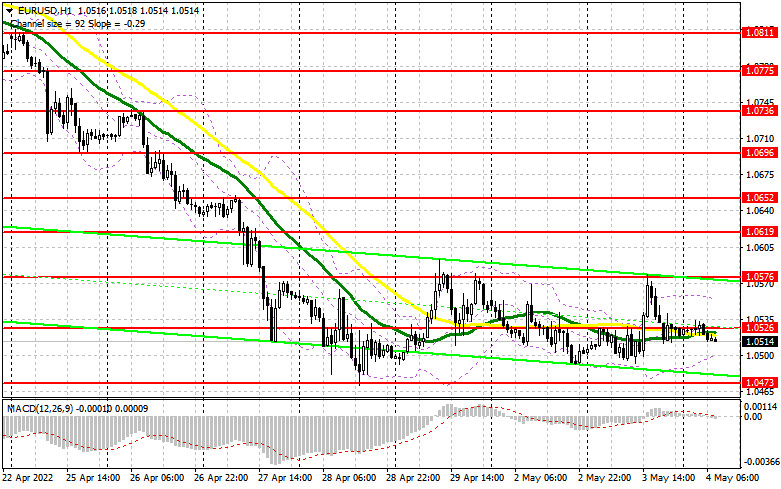
Today is a very important day. However, we will take a closer look at the Fed's meeting in our next review. Today, the eurozone is going to disclose a lot of reports that will have a minor influence on the market, but are likely to reflect the general trend of the eurozone business activity, a very important indicator of economic growth. Therefore, I recommend you pay attention to the services PMI reports from Germany, Italy, France, and the whole eurozone. It is also wise to focus on the composite PMI data from the eurozone. Lower business activity may intensify pressure on the euro, thus pushing the price to its yearly lows. A bit later, the eurozone will disclose its retail sales data for March. However, traders are unlikely to pay close attention to it. That is why today, buyers should protect this year's low at 1.0473. If data from the eurozone and Germany is weak, the euro/dollar may slump to 1.0473. Only a false break of this level will give a buy signal amid expectations that bulls will regain control over the market. In case of strong figures, the pair may recover to 1.0526. A break and a downward test of this level will give a new long signal, allowing the pair to climb to 1.0576, where it is recommended to lock in profits. A farther target is located at 1.0619. However, the pair will be able to hit this level after the FOMC meeting and only if the Fed chooses a more dovish approach. Notably, the US regulator will hardly change its stance. If the euro/dollar pair declines and buyers fail to protect 1.0473, it will be better to avoid opening buy orders. Traders may go long after a false break of a new yearly low of 1.0426. It is also possible to open buy orders from 1.0394 or lower –from 1.0347, expecting a rise of 30-35 pips.
Conditions for opening short positions on EUR/USD:
Bears are fully controlling the market. Yesterday, they took an advantage from a rise to the upper limit of the sideways channel and proved their dominance by pushing the price to the middle of the channel located at 1.0526. Ahead of the FOMC meeting, the number of sellers is not enough to make the price fall to 1.0473. That is why traders should be cautious when opening short positions even amid weak eurozone data. It is obvious that today the Federal Reserve will raise the benchmark rate by 0.5%. Thus, everything will depend on Jerome Powell's comments and the regulator's further policy. These factors may cause a new surge in the US dollar, thus pushing the euro/dollar pair even lower. To continue falling, the pair should decline to a new yearly low below 1.0473. Thus, it will be better to open short orders after a false break of 1.0526. This action may cause a first sell signal. In this case, the pair will be under pressure again and may drop to 1.0473. If the eurozone reveals weak reports, in the first part of the day, bulls and bears will try to gain control over the mentioned level. A break and settlement below 1.0473 as well as an upward test of this level may provide traders with a sell signal with the target at the yearly low of 1.0426 or even lower – at 1.0394, where it is recommended to lock in profits. A farther target is located at 1.0347. However, this scenario will become possible only after a bullish reaction of USD buyers to the FOMC meeting. If the euro rises in the first part of the day and bears fail to protect 1.0526, the pair may show a sharp increase. In this case, it will be wise to go short after a false break of 1.0576. It is also possible to sell the euro from 1.0619 or higher – from 1.0652, expecting a decline of 25-30 pips.
COT report
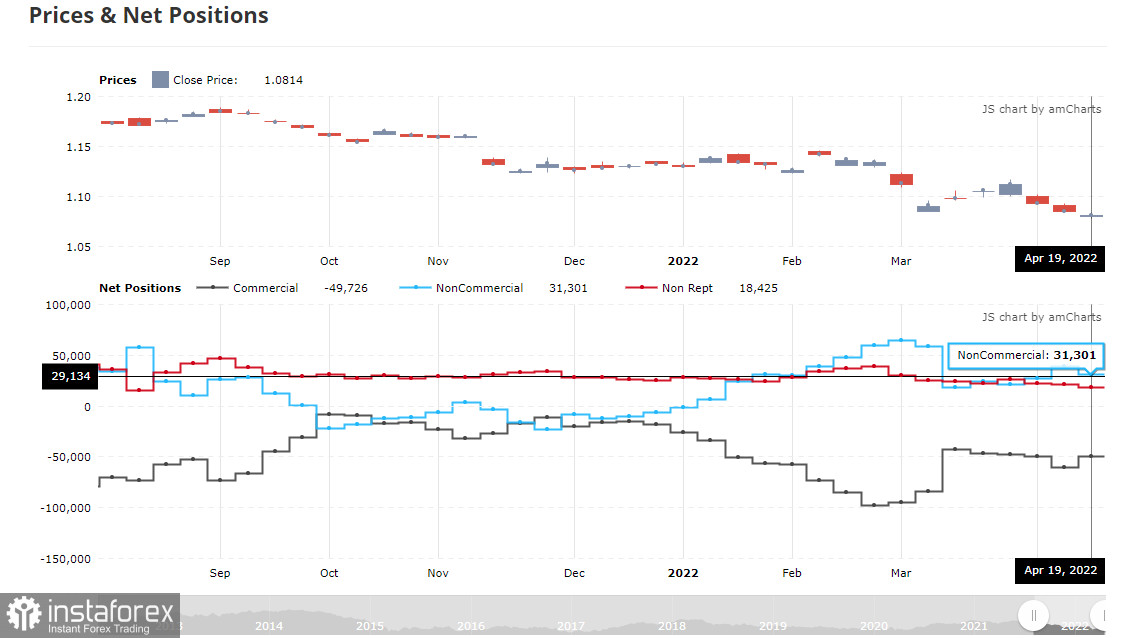
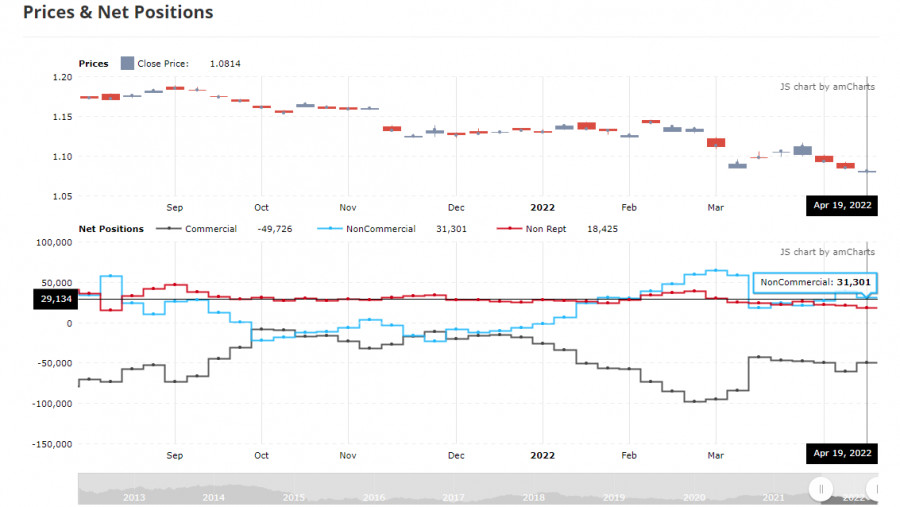
According to the COT report from April 19, the number of short positions jumped, whereas the number of long positions dropped. The recent comments provided by representatives of central banks led to a massive sell-off of risk assets. The central banks' officials made it clear that developed economies are likely to face grave problems this year. Although the ECB president emphasizes that the regulator is planning to close its asset-purchasing program by the end of the second quarter, it is not enough to support the euro. The Fed's more aggressive policy and its intention to raise the benchmark rate by 0.75% in May are supporting the greenback. In addition, global economic slowdown could be caused by quarantine measures imposed in China to curb the new virus wave. Such actions have already led to serious disruptions in supply to European and Asian countries. Against the backdrop, demand for the US dollar remains very high, thus pushing the euro/dollar pair lower. Military actions in Ukraine are also exerting pressure on the euro. The COT report unveiled that the number of long non-commercial positions dropped to 221,003 from 221,645, while short non-commercial positions surged to 189,702 from 182,585. The decline in the euro makes it more attractive for investors. At the end of the week, the total non-commercial net position decreased to 34,055 against 39,060. The weekly closing price collapsed to 1.0814 against 1.0855.
Signals of indicators:
Moving Averages
Trading is performed near 30- and 50-day moving averages, thus pointing to the market uncertainty.
Note: The period and prices of moving averages are considered by the author on the one-hour chart that differs from the general definition of the classic daily moving averages on the daily chart.
Bollinger Bands
If the pair breaks the lower limit of the indicator located at 1.0495, it is likely to go on losing value.
Description of indicators
- Moving average (moving average, determines the current trend by smoothing volatility and noise). The period is 50. It is marked in yellow on the chart.
- Moving average (moving average, determines the current trend by smoothing volatility and noise). The period is 30. It is marked in green on the graph.
- MACD indicator (Moving Average Convergence/Divergence - convergence/divergence of moving averages). A fast EMA period is 12. A slow EMA period is 26. The SMA period is 9.
- Bollinger Bands. The period is 20.
- Non-profit speculative traders are individual traders, hedge funds, and large institutions that use the futures market for speculative purposes and meet certain requirements.
- Long non-commercial positions is a total number of long positions opened by non-commercial traders.
- Short non-commercial positions is a total number of short positions opened by non-commercial traders.
- The total non-commercial net position is a difference in the number of short and long positions opened by non-commercial traders.