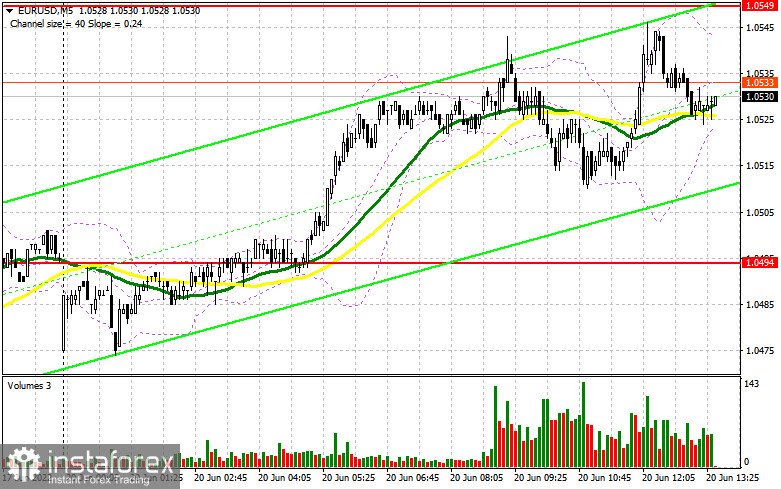
Earlier, I asked you to pay attention to the level of 1.0549 to decide when to enter the market. Let us take a look at the 5-minute chart to clear up the market situation. The absence of data from the eurozone led to a slump in the trading volume and volatility. As a result, the pair got stuck within the sideways channel, unable to hit neither support nor resistance levels mentioned earlier. That is why we did not receive any signal to enter the market. In the second part of the day, the technical picture is likely to be the same.
Conditions for opening long positions on EUR/USD:
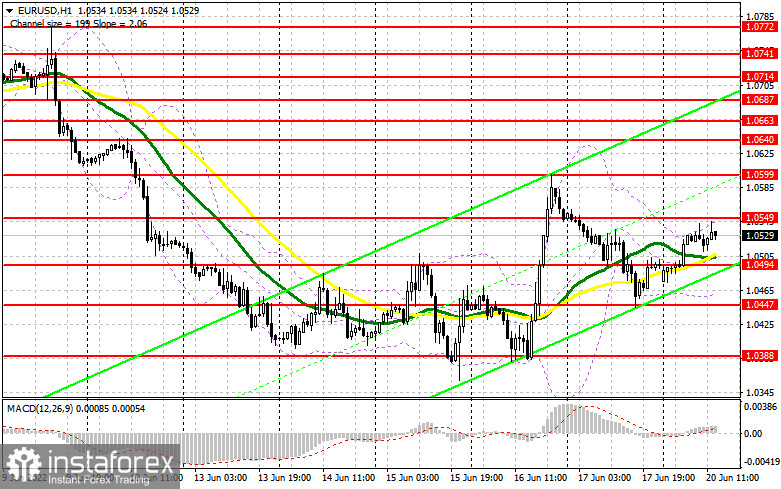
In the second part of the day, the US is not going to disclose any information. Only FOMC member James Bullard will provide a speech. I suppose that traders still remember Jerome Powell's comments made on Friday about the key interest rate and inflation as well as the US dollar's future. The Fed Chair said that the regulator's approach aimed at consumer price stability added to the confidence in the US dollar as a means of saving. He also pinpointed that the Fed would do everything it could to return inflation to the level of 2%. If Bullard's speech has the same character, bears may try to return pressure on the euro. If the euro drops, bulls should primarily protect the nearest level of 1.0494. Slightly below this level, there are bullish moving averages. Only a false break of this level will give a long signal with the target at the intermediate resistance level of 1.0549. A break and downward test of this level may negatively affect sellers' stop orders, thus providing traders with a long signal with the target at the correction high of 1.0599. The next target is located at 1.0640, where it is recommended to lock in profits. If the euro/dollar pair declines and buyers fail to protect 1.0494, the pair may enter the sideways channel again, thus creating new obstacles for buyers. In this case, traders should be cautious when entering the market. It will be better to go long after a false break of the support level of 1.0429. It is also possible to buy the euro/dollar pair from 1.0360 or lower – from 1.0306, expecting a rise of 30-35 pips.
Conditions for opening short positions on EUR/USD:
Sellers have every chance to regain control over the market. If the euro/dollar pair climbs in the second part of the day after James Bullard's speech, only a false break of the intermediate resistance level of 1.0549 will give a sell signal with the target at the support level of 1.0494. A lot depends on this level. A break and settlement below this level, weak data from the eurozone as well as an upward test will give an additional sell signal. In this case, the pair may slide to 1.0429. Traders should be very cautious opening sell orders since bulls are likely to benefit from the correction and increase the volume of long positions. It is obvious that the euro is oversold and now, the number of traders who want to open more short positions has dropped. A break and settlement below 1.0429 may push the price to 1.0360, where it is recommended to leave the market. If the pair climbs during the US trade and bears fail to protect 1.0549, it will be wise to avoid selling until the price hits 1.0599. A false break of this level may give a start to a new downward correction. It is also possible to sell the asset after a bounce off the high of 1.0640 or higher – from 1.0663, expecting a decline of 30-35 pips.
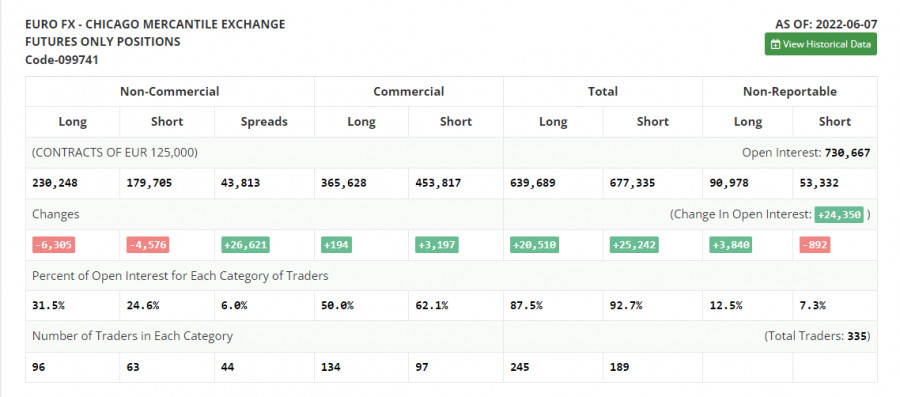
COT report
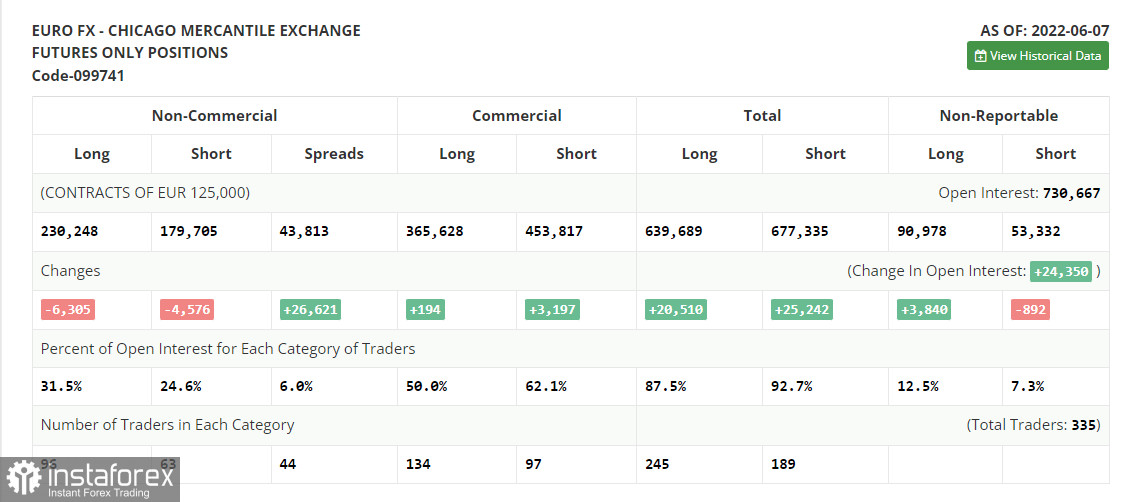
According to the COT report from June 7, the number of both long and short positions slumped. The fact is that most traders were very cautious expecting the ECB meeting. That is why market activity was very low. The time showed that it was a perfect idea to avoid trading. Last week, the ECB's representatives said that the regulator would raise the benchmark rate at the following meeting. However, even this announcement failed to prop up the euro. The US inflation data published on Friday caused a decline in risk assets, including the euro. A further trend of the euro/dollar pair depends on the Fed's decision on monetary policy and forecasts for the next few years. If the regulator's stance remains aggressive, the euro is likely to slide deeper to new yearly lows. The COT report unveiled that the number of long non-commercial positions declined by 6,305 to 230,248, while the number of short non-commercial positions dropped by 4,576 to 179,705. Although the euro is rather cheap, traders are not very interested in it. According to the week's results, the total non-commercial net position decreased to 50,543 against 52,272 a week earlier. The weekly closing price dropped to 1.0710 compared to 1.0742.
Signals of indicators:
Moving Averages
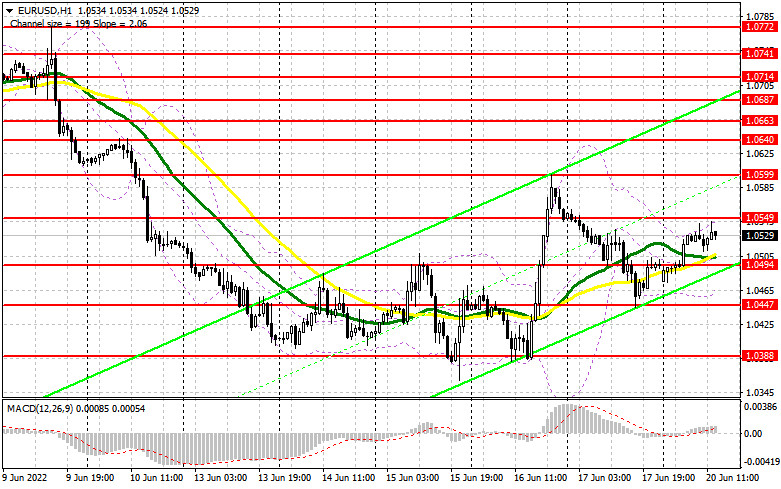
Trading is performed above 30- and 50-day moving averages, thus pointing to bulls' attempt to push the euro higher.
Note: The period and prices of moving averages are considered by the author on the one-hour chart that differs from the general definition of the classic daily moving averages on the daily chart.
Bollinger Bands
If the pair increases, the resistance level will be located at the higher limit of the indicator at 1.0550. In case of a decline, the support level will be located at a lower indicator's limit at 1.0465.
Description of indicators
- Moving average (moving average, determines the current trend by smoothing volatility and noise). The period is 50. It is marked in yellow on the chart.
- Moving average (moving average, determines the current trend by smoothing volatility and noise). The period is 30. It is marked in green on the graph.
- MACD indicator (Moving Average Convergence/Divergence - convergence/divergence of moving averages). A fast EMA period is 12. A slow EMA period is 26. The SMA period is 9.
- Bollinger Bands. The period is 20.
- Non-profit speculative traders are individual traders, hedge funds, and large institutions that use the futures market for speculative purposes and meet certain requirements.
- Long non-commercial positions is a total number of long positions opened by non-commercial traders.
- Short non-commercial positions is a total number of short positions opened by non-commercial traders.
- The total non-commercial net position is a difference in the number of short and long positions opened by non-commercial traders.