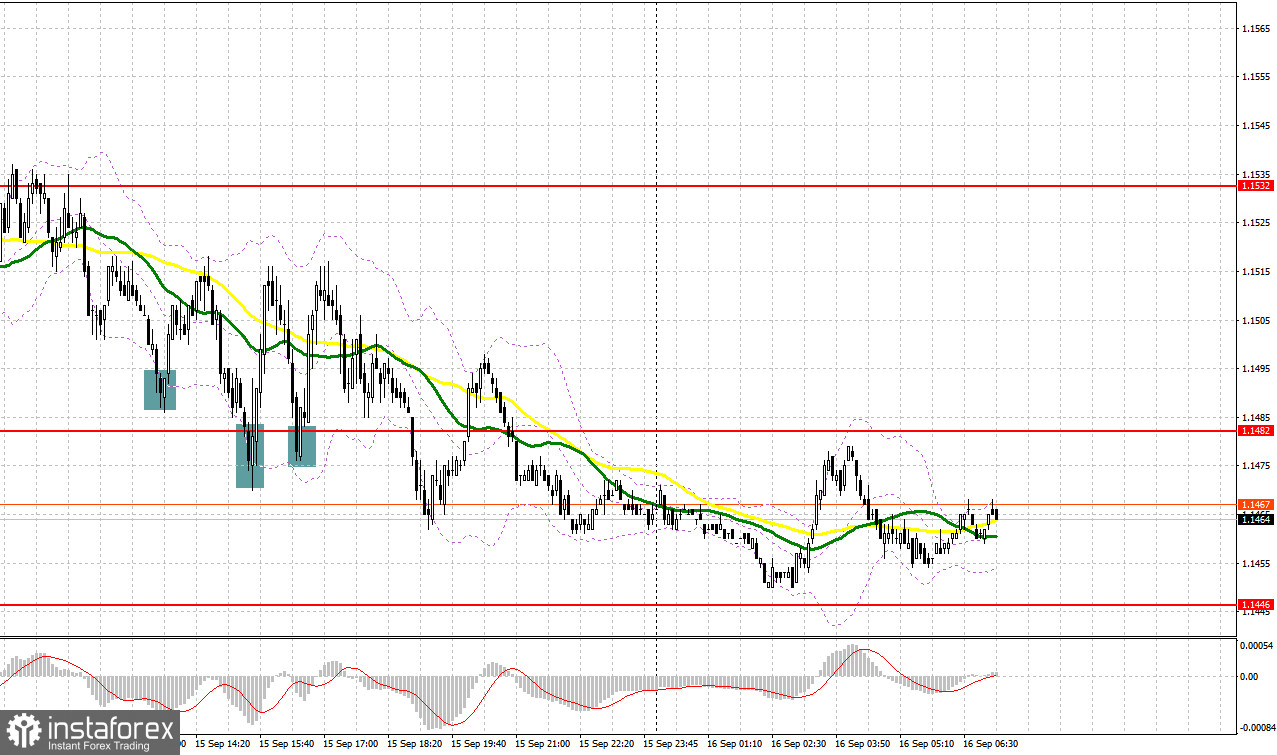
Several good market entry signals were formed yesterday. Let's take a look at the 5-minute chart and see what happened. I paid attention to the 1.1495 level in my morning forecast and advised making decisions on entering the market from it. The bears did not delay the attack and actively flunked the pound to the nearest support area of 1.1495, where I advised you to open long positions. A false breakout at 1.1495 only resulted in a 25-point bounce for the pound. In the afternoon, after reviewing the technical picture, the bulls continued to defend 1.1482, but the more often this level was tested, the less the pair bounced up - each time the movement was no more than 25 points. By the end of the trading session, 1.1482 was broken.
When to go long on GBP/USD:
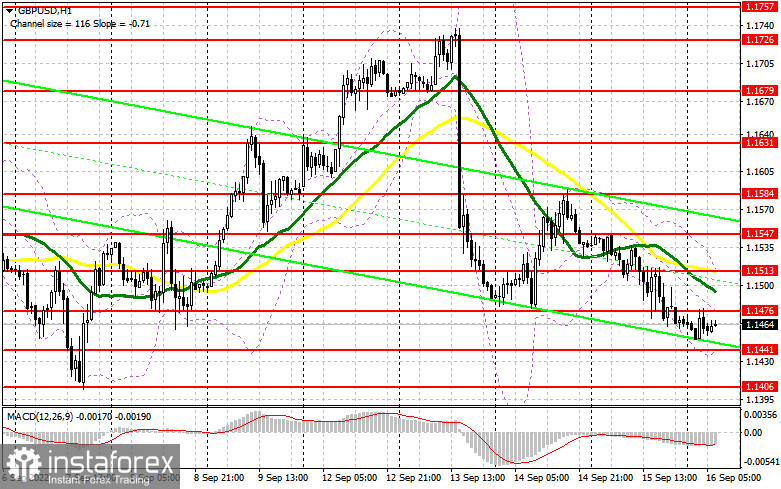
Data on the growth of retail sales in the US added pressure on the British pound, which is clearly aiming for a return to the September lows and their renewal. Today there is only a report on the change in the volume of retail trade excluding fuel costs in the UK for August this year, which clearly does not bring anything good, as economists fear a sharp decline in sales - this, theoretically, will harm the pound and indicate the deplorable state of the British an economy already suffering from a household cost of living crisis. The most convenient scenario for opening long positions in the current difficult conditions will be a false breakout in the area of the nearest support at 1.1441, formed at the end of the last week. In order to recover in this case, the goal will be the resistance of 1.1476, slightly above which the moving averages go, playing on the bears' side. Only a breakthrough and test to the downside of this range could pull speculators' stops in its wake, creating a new buy signal on the rise to the more distant 1.1513 level, allowing the bulls to stop the bear market and move trading into a horizontal channel. The farthest target will be the area of 1.1547, where I recommend taking profits.
In case GBP/USD falls and the bulls are not active at 1.1441, the pair will be under pressure again, which will open up the prospect of updating the September low. In this case, I advise you to postpone long positions until the next support at 1.1406. I recommend opening long positions on GBP/USD immediately for a rebound from 1.1358, or even lower - around 1.1313, counting on correcting 30-35 points within the day.
When to go short on GBP/USD:
The bears are slowly but surely pushing the pound to the September lows, taking advantage of good US statistics. Obviously, to keep the market under their control, they need to protect the nearest resistance at 1.1476, which will lead to an excellent signal to open new short positions - especially after UK retail sales data turn out to be worse than economists' forecasts. In this case, the immediate target will be the area of 1.1441, which will most likely be of an intermediate nature, although the bulls will try to show themselves there as much as possible so as not to leave everything at the last level of 1.1406. A breakthrough and reverse test of 1.1441 would provide a good sell entry point with a fall towards 1.1406. The farthest target will be a new yearly low of 1.1358.
In case GBP/USD grows and the bears are not active at 1.1476, a correction may lead to the area of 1.1513. Only a false breakout at this level will provide an entry point to short positions as we count on a slight downward movement from the pair. If traders are not active there, I advise you to sell GBP/USD immediately for a rebound from 1.1547, counting on the pair's rebound down by 30-35 points within the day.
COT report:
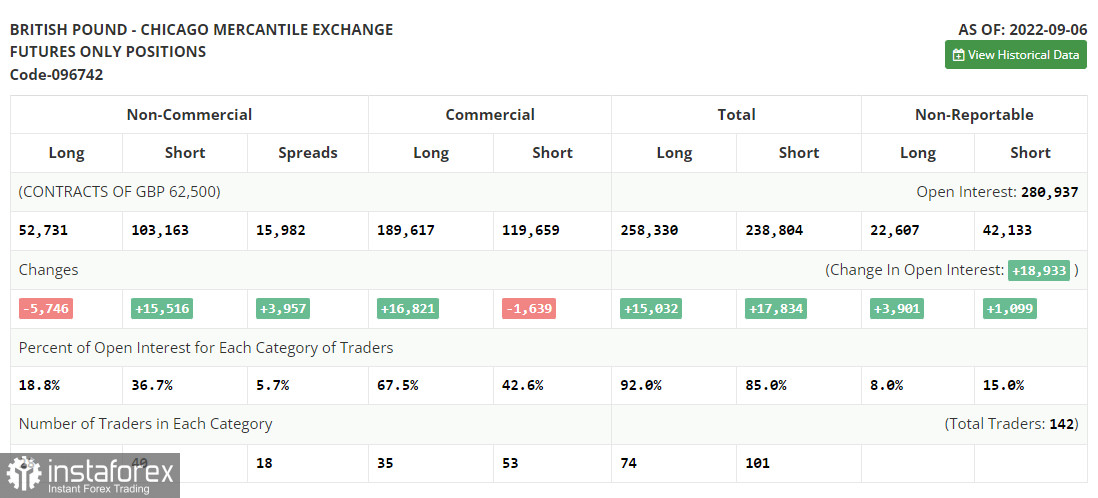
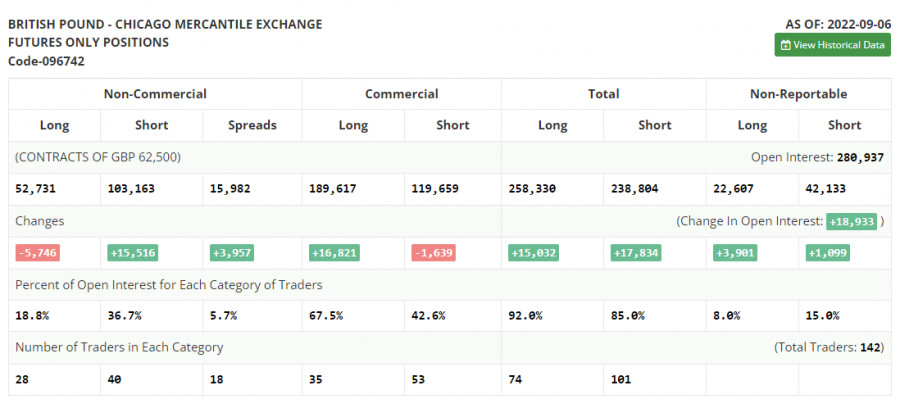
An increase in short positions and a decrease in long ones were recorded in the Commitment of Traders (COT) report for September 6. This once again confirms the fact that the British pound is in a major downward peak, from which it is not as easy to get out as it might seem. Last week, Bank of England Governor Andrew Bailey made a speech, who did his best to inspire confidence that the central bank will continue to follow the path of defeating inflation and continue to aggressively raise interest rates. This suggests that at its next meeting the committee will probably raise rates by 0.75% at once, following the example of other central banks. However, the UK economy is getting worse and worse, and GDP is shrinking quite quickly, as evidenced by recent reports, which does not give confidence to investors. With high inflation and a looming cost-of-living crisis in the UK, it will be quite difficult for bulls to get room to take long positions as nothing good is in store for the stats ahead. The latest COT report indicated that long non-commercial positions decreased by 5,746 to 52,731, while short non-commercial positions rose by 15,516 to 103,163, which led to an increase in the negative value of the non-commercial net position to -50,423 versus -29,170. The weekly closing price collapsed from 1.1526 against 1.1661.
Indicator signals:
Trading is below the 30 and 50-day moving averages, indicating a continuation of the bear market.
Moving averages
Note: The period and prices of moving averages are considered by the author on the H1 hourly chart and differs from the general definition of the classic daily moving averages on the daily D1 chart.
Bollinger Bands
In case the pair falls, the lower border of the indicator around 1.1441 will act as support. In case of growth, the upper border of the indicator around 1.1513 will act as resistance.
Description of indicators
- Moving average (moving average, determines the current trend by smoothing out volatility and noise). Period 50. It is marked in yellow on the chart.
- Moving average (moving average, determines the current trend by smoothing out volatility and noise). Period 30. It is marked in green on the chart.
- MACD indicator (Moving Average Convergence/Divergence — convergence/divergence of moving averages) Quick EMA period 12. Slow EMA period to 26. SMA period 9
- Bollinger Bands (Bollinger Bands). Period 20
- Non-commercial speculative traders, such as individual traders, hedge funds, and large institutions that use the futures market for speculative purposes and meet certain requirements.
- Long non-commercial positions represent the total long open position of non-commercial traders.
- Short non-commercial positions represent the total short open position of non-commercial traders.
- Total non-commercial net position is the difference between short and long positions of non-commercial traders.