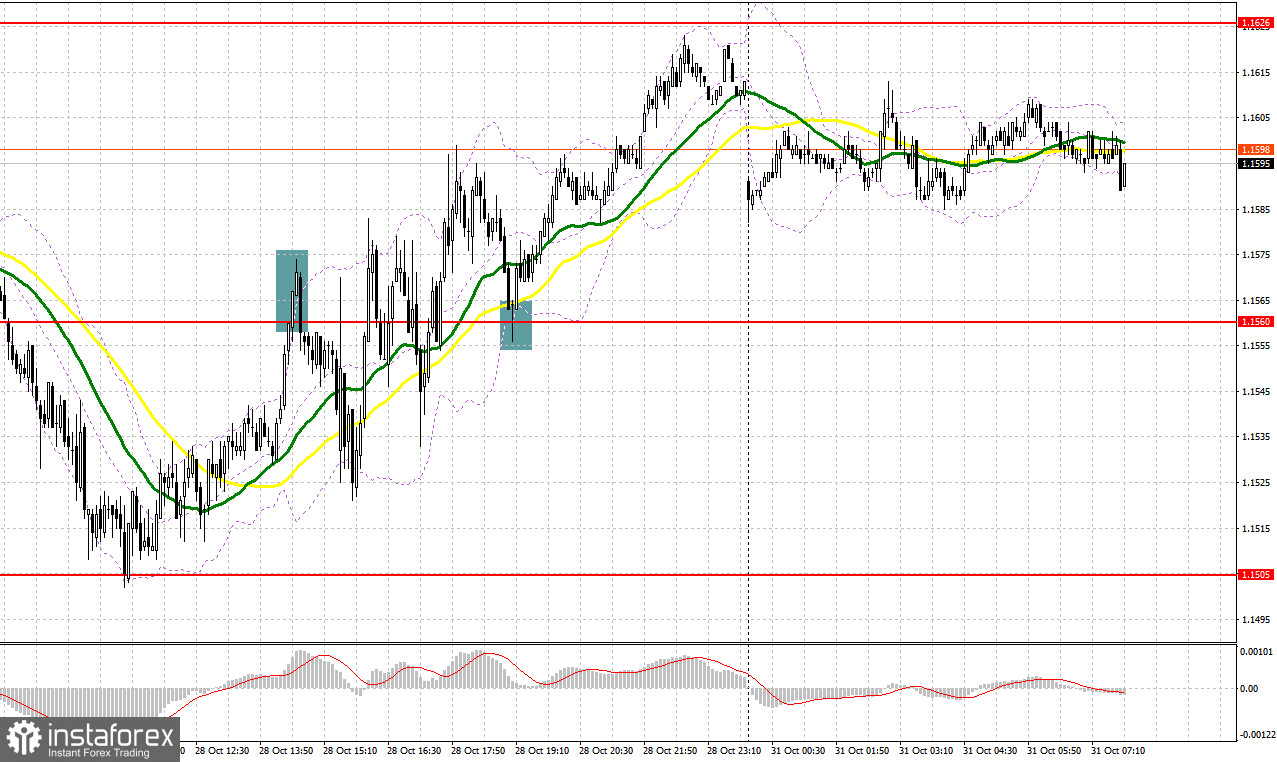
Several good market entry signals were formed last Friday. Let's take a look at the 5-minute chart and figure out what happened. I paid attention to the 1.1538 level in my morning forecast and advised making decisions on entering the market there. After a breakdown and a reverse test from below the level of 1.1538, a sell signal was formed, which resulted in the pound moving down by about 30 points. However, we did not reach the designated next support. The pound returned to 1.1560 in the afternoon, but failed to break through the first time. Failure to settle at 1.1560 resulted in a sell signal and a 35-pip move down. Then by the middle of the US session, a breakout and downward test of 1.1560 formed an entry point into long positions, as a result of which the pair went up about 50 points.
When to go long on GBP/USD:
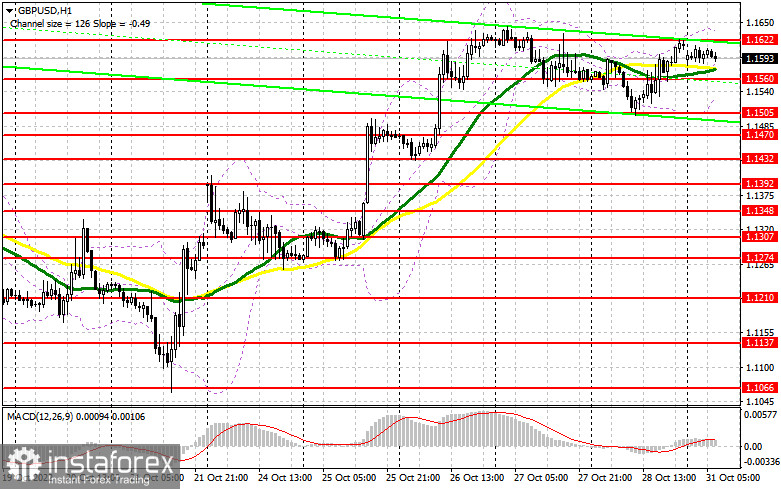
A fairly large amount of statistics on the UK will be released this week, and today is only a warm-up. It is unlikely that reports on the change in the volume of the M4 aggregate money supply, the number of approved applications for a mortgage loan and the volume of net loans to individuals will have an impact on the pound, but, on the other hand, this is good for the bulls: you can count on a continuation of the bull market and exit to new monthly highs. The only thing to remember is that today is the last day of the month, and it is unlikely that there will be those who want to aggressively buy the pound ahead of the important Federal Reserve meeting this week. If the pair goes down, forming a false breakout in the area of the nearest support at 1.1560 will provide a buy signal in order to restore and update the resistance at 1.1622, formed on the basis of last Friday. A breakthrough and a downward test of this range can dramatically change the situation, allowing bulls to build a more powerful upward trend with the prospect of updating 1.1683 and a further exit to 1.1722. The farthest target will be 1.1757, where I recommend locking in profits.
If the bulls do not cope with the tasks set and miss 1.1560, where the moving averages play on their side, then the pair will quickly be under pressure. In this case, I advise you to buy only on a false breakout in the area of 1.1505. I recommend opening long positions on GBP/USD immediately for a rebound from 1.1470, or even lower - around 1.1432 with the goal of correcting 30-35 points within the day.
When to go short on GBP/USD:
The bears, for starters, will try to keep the pair in the horizontal channel, which was formed at the end of last week, after their unsuccessful attempt to settle below 1.1560. If the stats I mentioned above turn out to be extremely disappointing, then the bears will have a chance to break 1.1560 and have a bigger downward move later this month. Despite this, the best scenario for opening short positions in the current conditions would be a false breakout in the resistance area of 1.1622. This will make it possible for us to get a good entry point with the goal of moving to support 1.1560. A breakthrough and reverse test from the bottom up of this range will be a good set-up to return to the lower border of the horizontal channel to the 1.1505 area. The farthest target will be the area of 1.1470, where I recommend locking in profits.
In case GBP/USD grows and the bears are not active at 1.1622, the bulls will continue to enter the market, counting on building an upward trend. This will push GBP/USD to the 1.1683 area. Only a false breakout at this level will provide an entry point into shorts with the goal of moving down. If traders are not active there, I advise you to sell GBP/USD immediately for a rebound from 1.1722, counting on the pair's rebound down by 30-35 points within the day.
COT report:
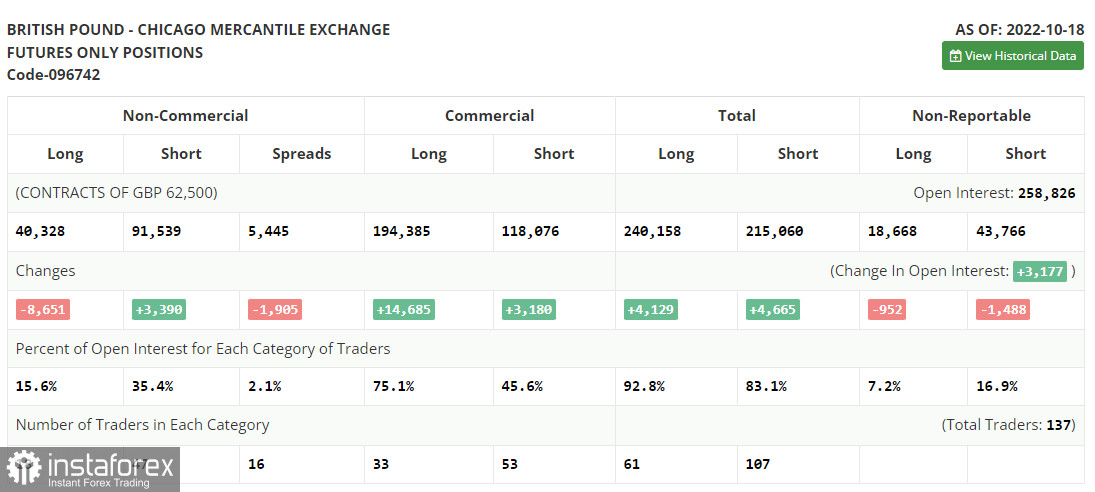
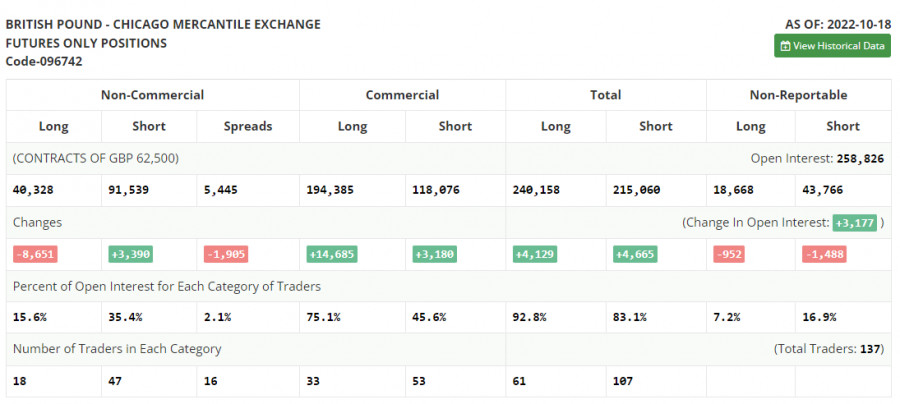
The Commitment of Traders (COT) report for October 18 logged a sharp reduction in long positions and an increase in shorts. The resignation of British Prime Minister Liz Truss and the appointment of Rishi Sunak to her post had a positive effect on the British pound, but rising inflation in the UK did not allow investors to fully believe that the economy would be able to endure all that awaits it in the near future: an increase in the cost of living crisis, an increase in the energy crisis and high interest rates. Also, there was a sharp decline in retail sales most recently in the UK - the main engine of economic growth, which once again confirms the fact that households have serious problems due to high prices, discouraging any desire to spend extra money. Until the UK authorities deal with the problems and find a way out of the current situation, the pressure on the pound will continue. The latest COT report indicated that long non-commercial positions decreased by 8,651 to 40,328, while short non-commercial positions rose by 3,390 to 91,539, resulting in a slight increase in the negative non-commercial net position to -51,211 versus -39,170. The weekly closing price increased and amounted to 1.1332 versus 1.1036.
Indicator signals:
Trading is carried out in the area of 30 and 50-day moving averages, which indicates the sideways nature of the market ahead of important data.
Moving averages
Note: The period and prices of moving averages are considered by the author on the H1 hourly chart and differs from the general definition of the classic daily moving averages on the daily D1 chart.
Bollinger Bands
In case of a decline, the lower border of the indicator around 1.1560 will act as support.
Description of indicators
- Moving average (moving average, determines the current trend by smoothing out volatility and noise). Period 50. It is marked in yellow on the chart.
- Moving average (moving average, determines the current trend by smoothing out volatility and noise). Period 30. It is marked in green on the chart.
- MACD indicator (Moving Average Convergence/Divergence — convergence/divergence of moving averages) Quick EMA period 12. Slow EMA period to 26. SMA period 9
- Bollinger Bands (Bollinger Bands). Period 20
- Non-commercial speculative traders, such as individual traders, hedge funds, and large institutions that use the futures market for speculative purposes and meet certain requirements.
- Long non-commercial positions represent the total long open position of non-commercial traders.
- Short non-commercial positions represent the total short open position of non-commercial traders.
- Total non-commercial net position is the difference between short and long positions of non-commercial traders.