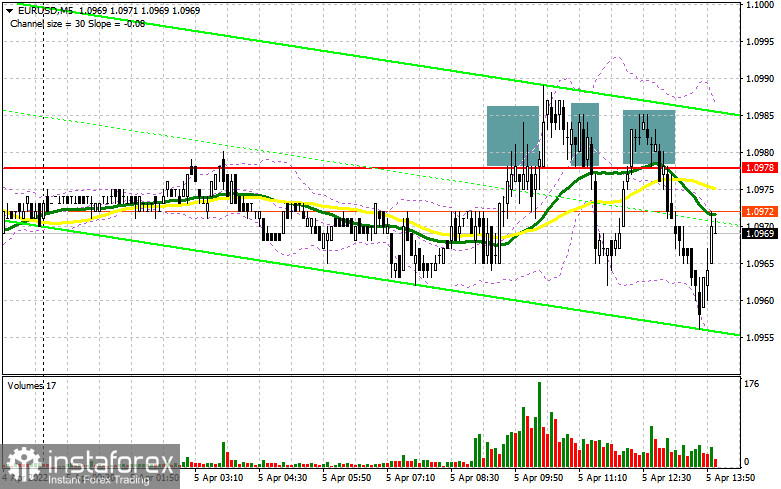
In my forecast this morning, I drew your attention to the level of 1.0978 and recommended entering the market from it. Let's have a look at the 5-minute chart and analyze what happened. Strong data on the Services PMI allowed euro buyers to hold the price above the weekly lows. The pair tried to break through 1.0978 but failed to do this. As a result of these attempts, there were several sell signals for the euro. It has not come to a large sell-off yet, but a drop by more than 20 pips cannot be ignored. The technical picture has changed considerably in the afternoon.
Long positions on EUR/USD:
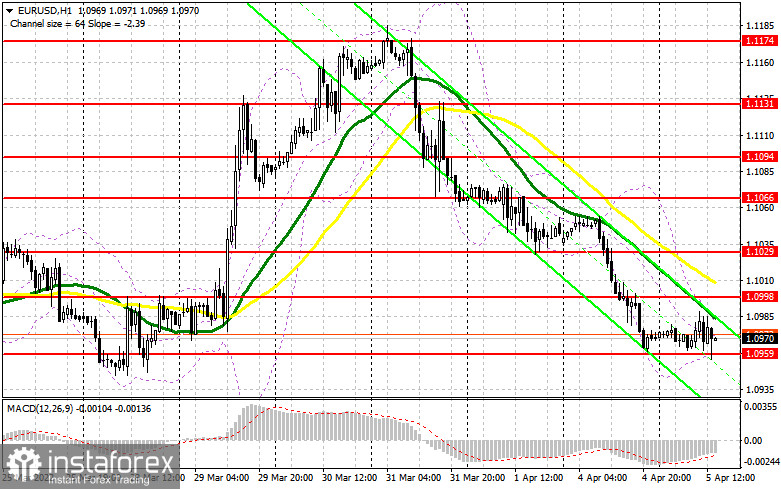
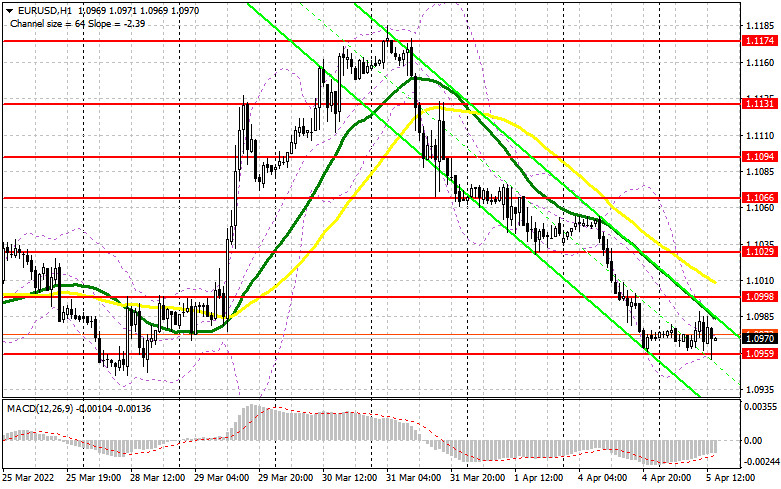
In the afternoon, the Services PMI will be released for the US. Some indices are likely to outperform the economists' expectations, which will increase the pressure on the euro and make it retest new major support near the weekly low at 1.0959. A false breakout of this level would be the first buy signal, counting on a fading bear market and the following uptrend in the pair. However, without good geopolitical news, it will be difficult for the euro to increase. Therefore, traders are recommended to hold short positions. Rumors that Europe may completely refuse the import of Russian gas, put pressure on the European currency. As I mentioned above, only the formation of a false breakout at 1.0959 will form the first entry point into longs. To see the bearish trend fading, bulls need to push the pair above 1.0998, where the moving averages are located. The MAs are on the side of bears now. Even if the data of the USA appears to be weak, it is unlikely that bulls will rush to open long positions in the euro, but if the most positive scenarios come true, a breakthrough and a top/bottom test of 1.0998 cannot be ruled out. That is likely to create another buy signal, which may allow the pair to recover to the area of 1.1029 and 1.1066, where traders can lock in profits. In case of further decline in the pair and a lack of activity from bulls at 1.0959, it is better to postpone opening long positions. A false breakout of the low at 1.0928 would be an optimal level to open longs. Long positions in the euro can be opened on a pullback only from 1.0903, or lower near 1.0855, allowing an upward intraday correction of 30-35 pips.
Short positions on EUR/USD:
Bears did not show much activity in the first half of the day, but they successfully coped with their set of tasks, which leaves chances for the pair to fall further. Rumors that negotiations on the Ukrainian side are dragging on and the lack of good news on the geopolitical stage negatively affect market sentiment, which puts even more pressure on the euro. Though the pair managed to reach new weekly lows in the afternoon, bears need to close today's trading session below 1.0959. A breakthrough and a bottom/top test of this level are likely to create the first sell signal, which will open the way to the lows of 1.0928 and 1.0903, where traders may take profits. If the euro rises in the second half of the day, bears need to hold the price above 1.0998. This may allow the pair to make a false breakout at this level. If weak data in the US is released and bears show a lack of activity at this level, bulls may try to regain control over the market. Then the best scenario would be to take short positions if a false breakout occurred near 1.1029. Selling the EUR/USD pair on the rebound would be possible from 1.1066, or higher near 1.1094, allowing a downward correction of 20-25 pips.
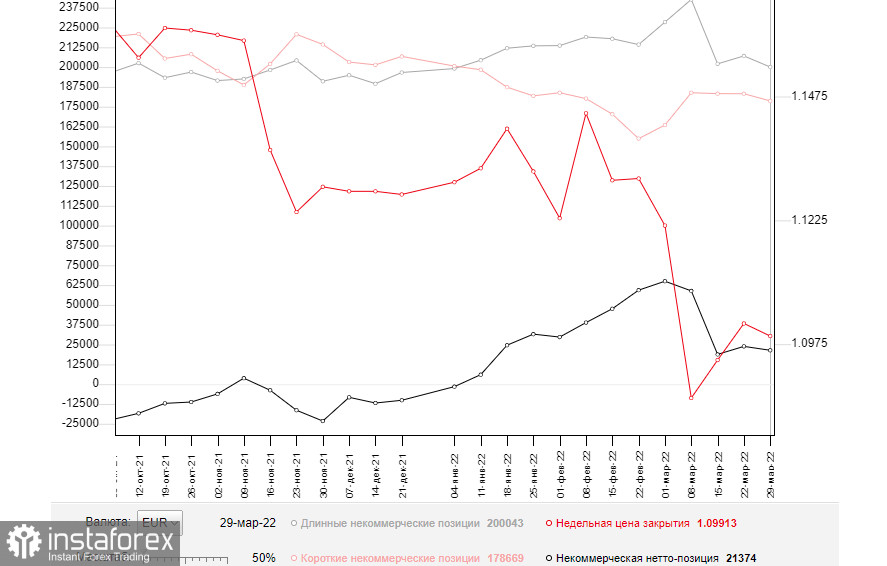
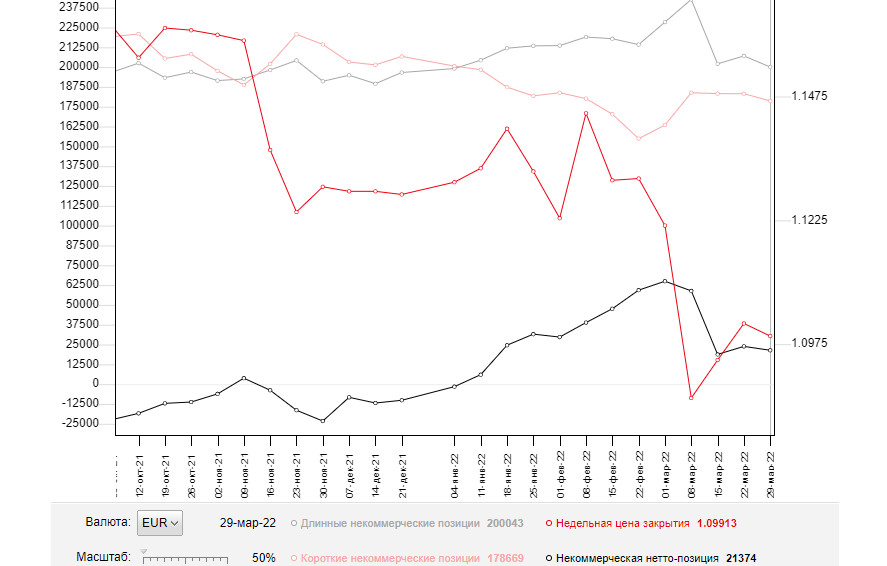
The COT (Commitment of Traders) report for March 29 showed a decrease in both short and long positions. Notably, more buyers were leaving the market than sellers. This indicates pessimism due to geopolitical events. The risk of higher inflation in the euro area, which already reached 7.5% in March, is the main concern of the European Central Bank. Last week, ECB President Christine Lagarde announced plans for a more aggressive rollback of the economic support program and several hikes in the interest rate. It was good for the medium-term outlook of the euro, which is already heavily oversold against the US dollar. However, the lack of positive results from the Russia-Ukraine talks and rising geopolitical tensions are negatively affecting the euro. Problems in the Eurozone economy, which are already occurring due to excessively high inflation and Russia's sanctions, including the settlement of gas payments in rubles, will continue to put pressure on the euro in the short term. Therefore, it is better not to count on the growth of the pair for the time being. The COT report indicates that long non-commercial positions declined to 200,043 from 207,051, while short non-commercial positions declined to 178,669 from 183,208. Given that the decline in short positions was more impressive, the week's total non-commercial net positions were down to 21,374 against 23,843. The weekly closing price declined to 1.0991 from 1.1016.
Indicators' signals
Moving averages
The pair is trading below the 30- and 50- day moving averages, which indicates a further decline of the euro.
Note: Period and prices of moving averages are considered by the author on hourly chart H1 and differ from the common definition of classic daily moving averages on daily chart D1.
Bollinger Bands
In the case of the growth of the pair, the upper boundary of the indicator at 1.0977 will act as resistance.
Description of indicators
- Moving average defines the current trend by smoothing volatility and noise. Period 50. Marked in yellow on the chart.
- Moving average defines the current trend by smoothing volatility and noise. Period 30. Marked in green on the chart.
- MACD (Moving Average Convergence/Divergence) indicator Fast EMA 12. Slow EMA 26. SMA 9.
- Bollinger Bands. Period 20.
- Non-commercial traders are speculators, such as individual traders, hedge funds, and large institutions, which use the futures market for speculative purposes and meet certain requirements.
- Long non-commercial positions represent the total number of open long positions of non-commercial traders.
- Short non-commercial positions represent the total number of open short positions of non-commercial traders.
- The total non-commercial net position is the difference between short and long positions of non-commercial traders.