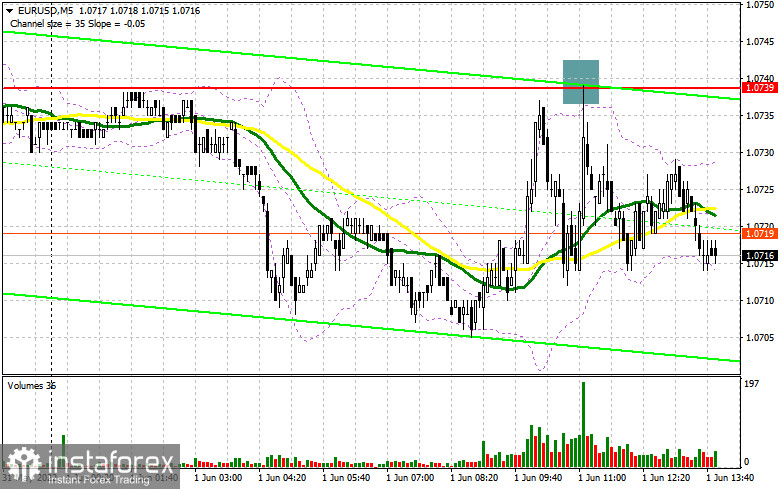
In the morning article, I highlighted the level of 1.0739 and recommended taking decisions with this level in focus. Now let's look at the 5-minute chart and try to figure out what actually happened. The first attempt to reach 1.0739 was not crowned with success. Shortly after, the bulls increased long positions following the release of the Eurozone Manufacturing PMI Index. The reading turned out to be better than expected. The pair tried once again to break above 1.0739. A false breakout of this level gave an excellent sell signal with the prospect of further correction. At the time of writing the article, the pair has already declined by 25 pips. The euro is likely to maintain its downward movement as long as it is trading below 1.0739.
What is needed to open long positions on EUR/USD
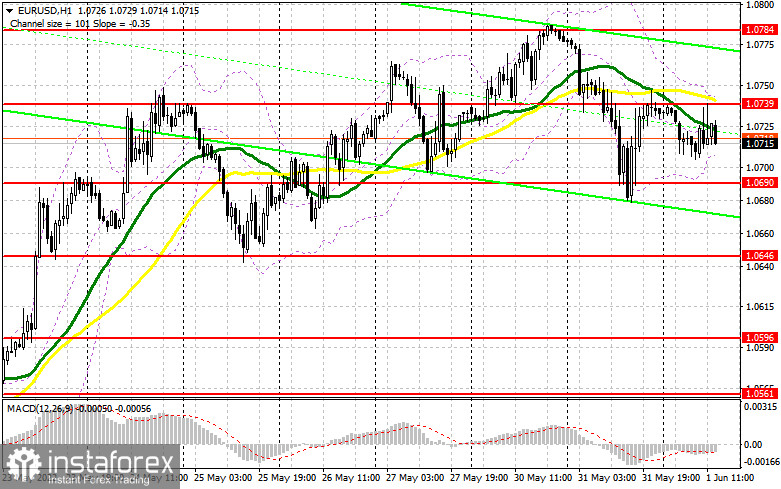
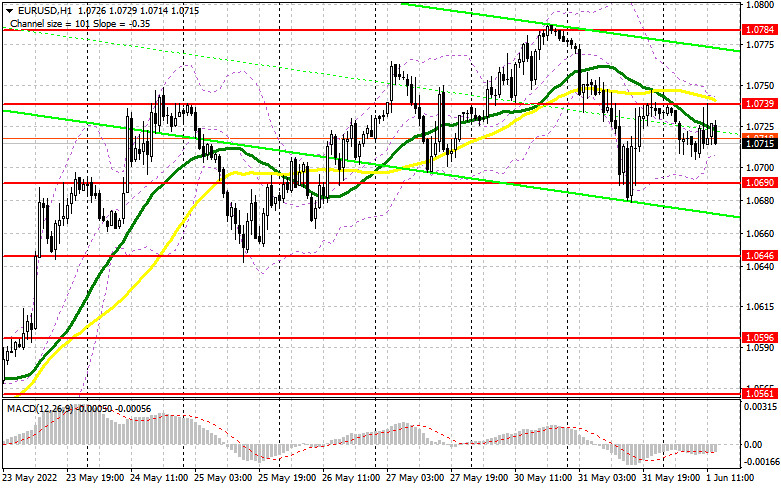
The technical outlook has not changed. The Manufacturing PMI index turned out to be positive. Only in Italy, the Manufacturing PMI index dropped to the 50 level, which signals the lack of expansion. In the afternoon, the US will unveil a batch of crucial macroeconomic reports. Several Fed members will deliver their speeches. Their tone will have a big impact on the further movement of the euro/dollar pair. If FOMC member James Bullard makes no comments on inflation, then the pair may remain in the sideways channel. However, after the release of the Manufacturing PMI Index and ADP data, bearish sentiment is likely to prevail. For this reason, I advise you to be extremely cautious when going long. It is better to open long positions only after a false breakout of 1.0690. These conditions will provide a good long signal within the bullish movement, unfolding since mid-May this year. The pair may also return to the resistance level of 1.0739. Notably, the pair failed to break above this level in the first half of the day. The moving averages are passing in the bearish territory at this level. It may limit upward movement. A breakout and a downward test of this level, which is likely to take place amid weak US macro statistics, will give a new buy signal. It will also open the way to last month's high of 1.0784. The pair will hardly approach a more distant target of 1.0811 today. Taking into account the bullish sentiment, I do not rule out such a scenario. If EUR/USD declines and bulls show no activity at 1.0690 in the afternoon, the pressure on the euro will escalate. A sharp fall in stop-loss orders below this level in anticipation of a larger downward correction will push the pair to 1.0646. Therefore, it is recommended to open long positions after a false breakout of this level. I advise buying EUR/USD immediately at a bounce from the level of 1.0596 or even a low around 1.0561 keeping in mind an upward intraday correction of 30-35 pips.
What is needed to open short positions on EUR/USD
The bears successfully defended the nearest resistance level of 1.0739. As I have already mentioned above, it leaves room for a further drop. In case of negative US data, the pressure on the US dollar will increase. If so, it may slide down to 1.0739. A false breakout of this level will generate a sell signal against the trend. The price may return to the support level of 1.0690. Importantly, the pair failed to reach this level in the first half of the day. A decline below 1.0690, as well as an upward test of this level and hawkish statements of Fed members on inflation, will give a sell signal. It is likely to erase buyers' stop-loss orders. As a result, the price could slip to 1.0646. I would recommend traders close some of their short positions at this level. A more distant target will be the 1.0596 level where it is better to completely close short positions. If EUR/USD rises during the US session and bears show no energy at 1.0739, bulls are sure to exhibit strength. In this case, the uptrend will prevail. It would be wise to open short positions after a false breakout near the last month's high of 1.0784. You can sell EUR/USD immediately at a bounce from 1.0844 or even a high around 1.0894, keeping in mind a downward intraday correction of 30-35 pips.
COT report
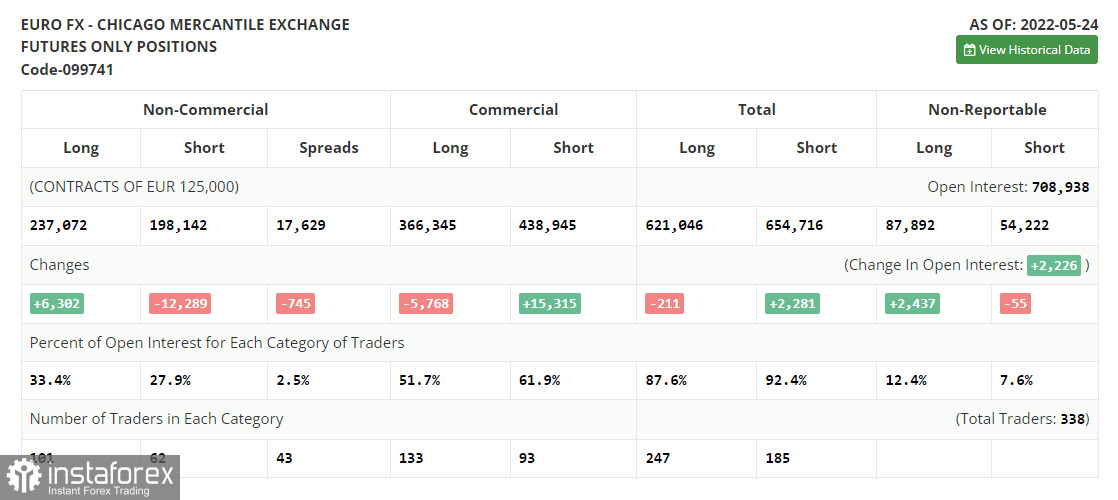
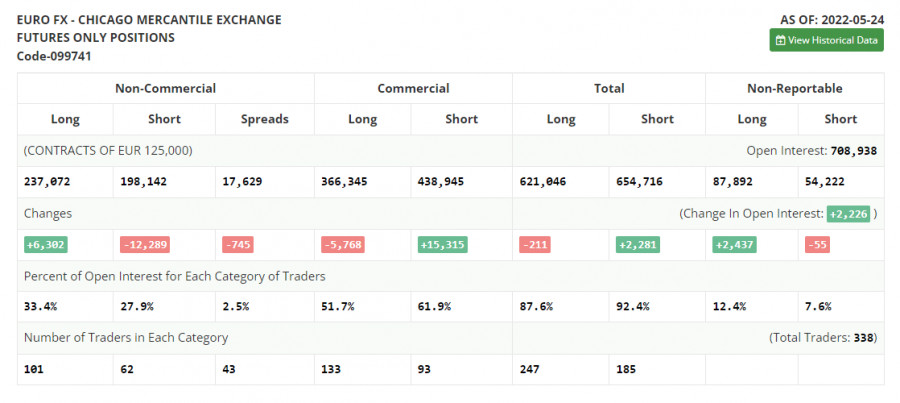
The COT report for May 24 logged a further increase in long positions and a drop in short ones. Traders continue to increase long positions on the instrument, expecting aggressive moves by the ECB. Last week, the euro advanced significantly even though ECB policymakers made only a few hawkish statements. Now, the regulator is expected to raise the key rate by a quarter-point in July this year, followed by rate hikes in September and in December. The benchmark rate could be lifted to 0.25% by the end of the year. Some experts anticipate more aggressive measures from the ECB if inflation soars to 7.7% in May. The watchdog may hike the key rate in September and December to 0.5% from the current zero level. The COT report revealed that the number of long non-commercial positions rose by 6,302 to 237,072 from 230,770. The number of short non-commercial positions declined by 12 289 to 198,142 from 210,431. Notably, the weaker euro is more attractive to traders. Last week, the total non-commercial net position grew to 38,930 against 20,339 a week earlier. The weekly closing price edged higher to 1.0734 against 1.0556.
Signals of technical indicators
Moving averages
EUR/USD is trading near 30- and 50-period moving averages. It means that the pair is moving in the sideways channel.
Remark. The author is analyzing the period and prices of moving averages on the 1-hour chart. So, it differs from the common definition of classic daily moving averages on the daily chart.
Bollinger Bands
In case of a decline, the lower border around 1.0705 will act as support. In case of a rise, the upper border at 1.0739 will act asresistance.
Definitions of technical indicators
- Moving average recognizes an ongoing trend through leveling out volatility and market noise. A 50-period moving average is plotted yellow on the chart.
- Moving average identifies an ongoing trend through leveling out volatility and market noise. A 30-period moving average is displayed as the green line.
- MACD indicator represents a relationship between two moving averages that is a ratio of Moving Average Convergence/Divergence. The
- MACD is calculated by subtracting the 26-period Exponential Moving Average (EMA) from the 12-period EMA. A 9-day EMA of the MACD called the "signal line".
- Bollinger Bands is a momentum indicator. The upper and lower bands are typically 2 standard deviations +/- from a 20-day simple moving average.
- Non-commercial traders - speculators such as retail traders, hedge funds, and large institutions who use the futures market for speculative purposes and meet certain requirements.
- Non-commercial long positions represent the total long open position of non-commercial traders.
- Non-commercial short positions represent the total short open position of non-commercial traders.
- The overall non-commercial net position balance is the difference between short and long positions of non-commercial traders.