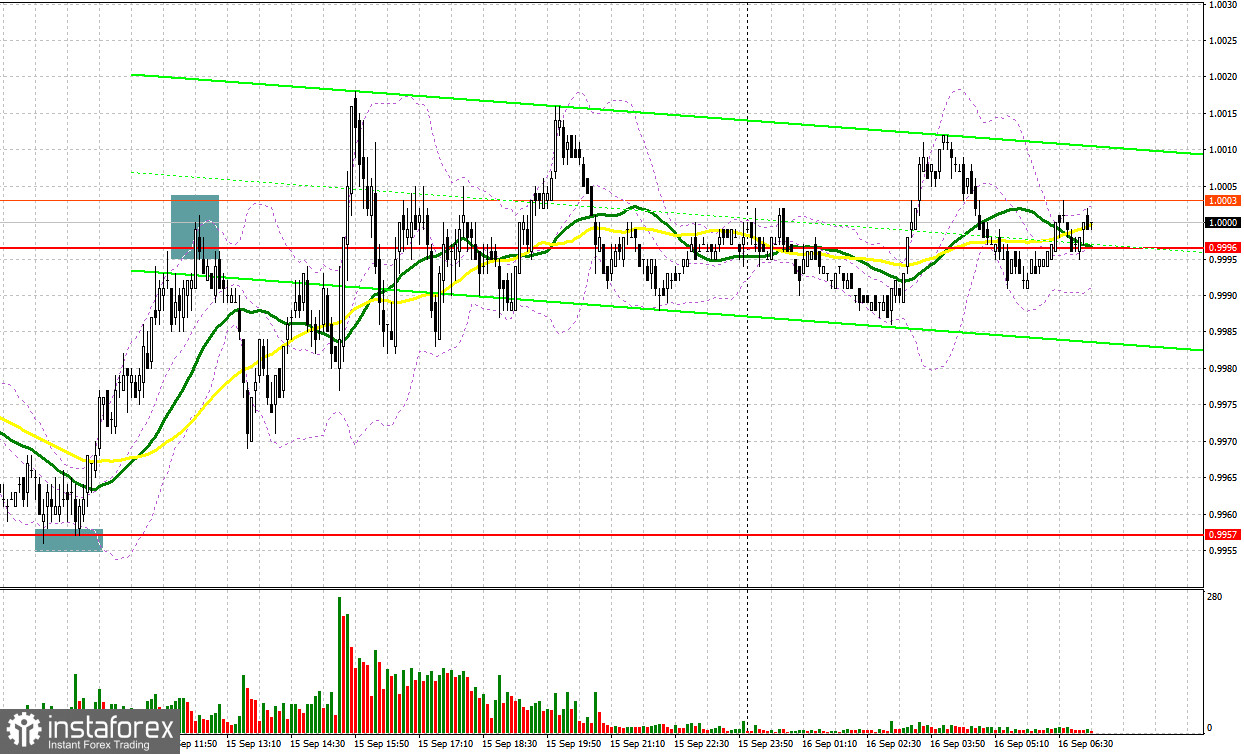
Several excellent market entry signals were formed yesterday. Let's take a look at the 5-minute chart and see what happened. I paid attention to the 0.9957 level and the 0.9996 level in my morning forecast and advised making decisions on entering the market. Bulls protecting support at 0.9957 resulted in an excellent signal to buy the euro in the first half of the day, which resulted in an increase of more than 40 points to the 0.9996 area. I expected the bears to be active there. A false breakout at this level resulted in a signal to open short positions, and at the moment the pair collapsed by 25 points at once. After a surge in volatility in the afternoon, which occurred as a result of mixed fundamental statistics for the US, trading was mainly carried out around the level of 0.9996 and it was not possible to get clear signals to enter the market.
When to go long on EUR/USD:
Monthly growth in retail sales in the US and a rather large annual decline did not allow the US dollar to seize the initiative. As a result, the pair continued to trade in the narrow horizontal channel it has been in since Wednesday. This morning we have data on the consumer price index in Italy and the consumer price index in the euro area. The latter will be quite important. If inflation in the eurozone continues to grow in August, and according to economists' forecasts, the index should remain unchanged and amount to 9.1%, then the demand for the euro may return at the moment, as this will force the European Central Bank to continue a rather serious fight against inflation through higher interest rates. On the other hand, an increase in borrowing costs has never led the economy to develop, so it is safe to expect it to continue to slide into recession - this hurts the euro in the long run. In case the pair is under pressure again, it is best not to rush into long positions. The optimal scenario would be a false breakout near the new support at 0.9984, which is the middle of the horizontal channel. This will provide an entry point for a larger up correction with an immediate recovery target towards 1.0015. As I noted above, strong eurozone statistics could help the euro, so a breakthrough and test from 1.0015 would hit bearish stops, which would create another signal to open long positions with the possibility of a push up to the 1.0050 area. A more distant target will be resistance at 1.0084, where I recommend taking profits.
If the EUR/USD declines and there are no bulls at 0.9984, the pressure on the pair will increase. The optimal decision to open long positions in such conditions would be a false breakout near the low of 0.9957. I advise you to buy EUR/USD immediately on a rebound only from 0.9922, or even lower - in the area of 0.9880, counting on an upward correction of 30-35 points within the day.
When to go short on EUR/USD:
The bears continue to control the upper limit of the horizontal channel, which coincides with the parity of the euro against the dollar, thereby controlling the entire market. The longer the pair is below 1.0000, the more likely it is that the euro would fall further along with the renewal of annual lows. And so the bears' main task is to protect the resistance of 1.0015, the test of which may occur in case we receive good statistics on the euro area. I expect big players to appear from 1.0015, so along with a false breakout, you can open short positions in order to further move the euro down to 0.9984. A breakdown and consolidation below this range with a reverse test from the bottom up creates another sell signal with the removal of bulls' stop orders and a larger fall of the pair to the lower border of the horizontal channel at 0.9957. I recommend taking profit there. A more distant target will be a low of 0.9922.
If EUR/USD jumps during the European session, as well as the absence of bears at 1.0015, the demand for the euro will increase, and an upward correction will lead to the next resistance at 1.0050. In this scenario, I recommend opening short positions from 1.0050 only if a false breakout is formed. You can sell EUR/USD immediately on a rebound from the high of 1.0084, or even higher - from 1.0118, counting on a downward correction of 30-35 points.
COT report:
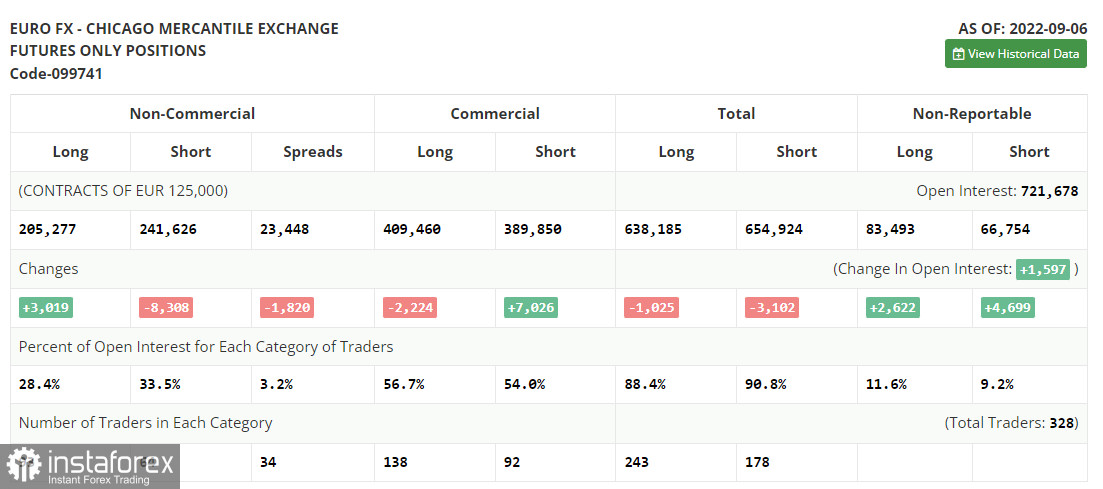
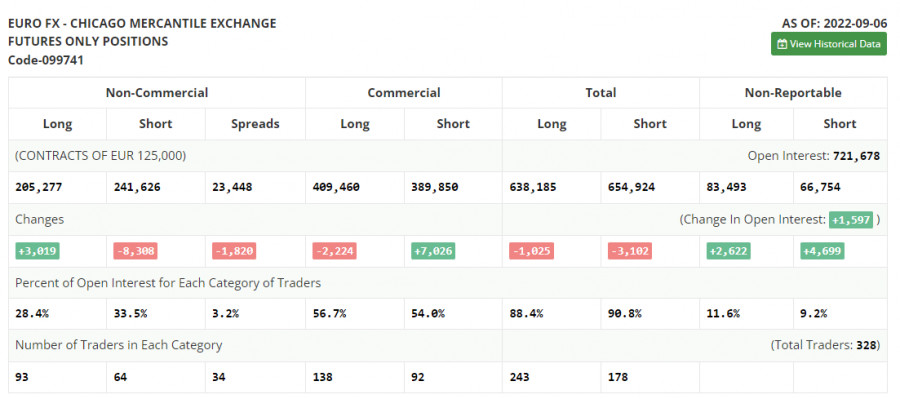
The Commitment of Traders (COT report) on September 6 logged a decline in short positions and a sharp increase in long positions. Considering that all this was ahead of the European Central Bank meeting, at which the central bank raised interest rates by 0.75% at once, such changes are not surprising. With an ever smaller gap in interest rates between the Federal Reserve and the ECB, the demand for the euro will gradually return, but you need to understand how difficult the European economy is now and how difficult it will be for this winter period - especially with such high energy prices due to the deficit. In the US, the Fed also plans to raise interest rates by 0.75% as early as next week, but quite a lot will depend on what inflation data comes out. If the growth rate of consumer prices remains at a high level, the central bank will not hesitate for a long time. The COT report indicated that long non-commercial positions rose by 3,019 to 205,277, while short non-commercial positions decreased by 8,308 to 241,626. As of the end of the week, the overall non-commercial net position remained negative, but rose slightly to -36,349 against -487,676, which indicates the first prerequisites for building an upward correction for the pair and finding the bottom. The weekly closing price decreased and amounted to 0.9917 against 1.0033.
Indicator signals:
Moving averages
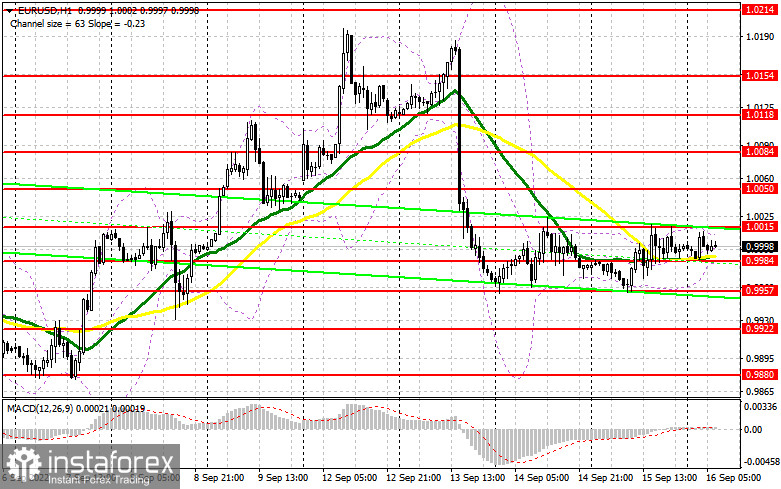
Trading is conducted in the area of 30 and 50-day moving averages, which indicates some market uncertainty.
Note: The period and prices of moving averages are considered by the author on the H1 hourly chart and differs from the general definition of the classic daily moving averages on the daily D1 chart.
Bollinger Bands
In case of a decline, the lower border of the indicator around 0.9984 will act as support. In case of growth, the upper border of the indicator in the area of 1.0015 will act as resistance.
Description of indicators
- Moving average (moving average, determines the current trend by smoothing out volatility and noise). Period 50. It is marked in yellow on the chart.
- Moving average (moving average, determines the current trend by smoothing out volatility and noise). Period 30. It is marked in green on the chart.
- MACD indicator (Moving Average Convergence/Divergence — convergence/divergence of moving averages) Quick EMA period 12. Slow EMA period to 26. SMA period 9
- Bollinger Bands (Bollinger Bands). Period 20
- Non-commercial speculative traders, such as individual traders, hedge funds, and large institutions that use the futures market for speculative purposes and meet certain requirements.
- Long non-commercial positions represent the total long open position of non-commercial traders.
- Short non-commercial positions represent the total short open position of non-commercial traders.
- Total non-commercial net position is the difference between short and long positions of non-commercial traders.