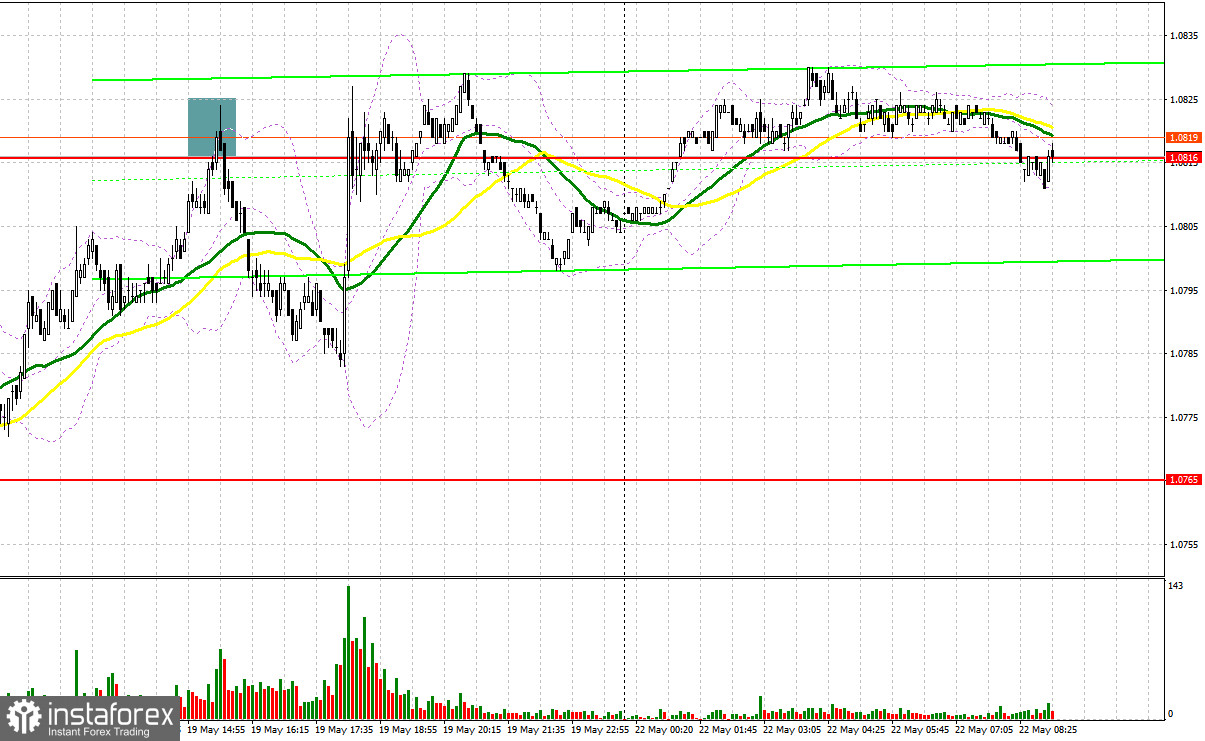
On Friday, there were several trading signals. Now, let's look at the 5-minute chart and figure out what actually happened. In my morning article, I turned your attention to 1.0786 and recommended making decisions with this level in focus. A rise and a false breakout of 1.0786 led to a sell signal. After moving down by 15 pips, the bearish pressure eased. Traders were unwilling to sell the pair at the swing lows. In the afternoon, short positions at 1.0816 brought about 25 pips of profit. Jerome Powell's speech triggered a jump in the euro.
When to open long positions on EUR/USD:
Fed Chairman Jerome Powell said on Friday that "our policy rate may not need to rise as much as it would have otherwise to achieve our goals." However, the main priority for the regulator remains the same – returning inflation to the 2% target. His comments led to a slight increase in the euro. However, bulls failed to take advantage of it.
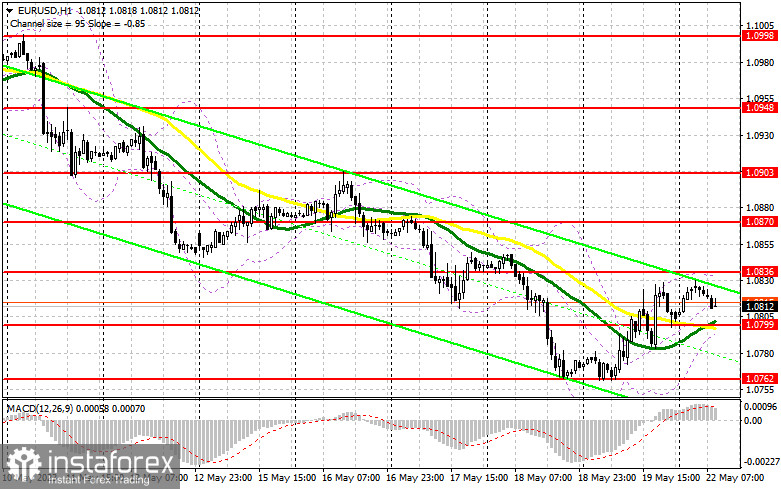
Today, the Euro Area Construction PMI and the Consumer Confidence Index are on tap. coming out. However, traders are likely to pay zero attention to these reports. Therefore, I expect the pair to remain in the sideways channel. It is better to open positions only after the decline and a false breakout of 1.0799 where the moving averages are passing in positive territory. It will signal the presence of large traders in the market who want to push the euro higher at the start of the week. It will give new entry points into long positions. The pair could advance to the resistance level of 1.0836. Only a breakout and a downward retest of this level after the news on the results of the debt-ceiling negotiations will facilitate demand for the euro, providing a new buy signal. The euro may reach 1.0870. A more distant target is located at the 1.0903 level where I recommend locking in profits.
If EUR/USD declines and bulls show no activity at 1.0799, which is quite likely in such a bear market, bearish sentiment will prevail. Therefore, only a false breakout of the support level of 1.0762 will create new entry points into long positions. You could buy EUR/USD at a bounce from the low of 1.0716, keeping in mind an upward intraday correction of 30-35 pips.
When to open short positions on EUR/USD:
Bears continue to control the market even despite a small upward correction of the pair. They need to defend the resistance level of 1.0836 to cement the downtrend. A false breakout of this level will give a sell signal, pushing the pair to the support level of 1.0799 and then to the monthly low of 1.0762. Consolidation below this level as well as an upward retest could trigger a fall to 1.0716. A more distant target will be the low of 1.0674 where I recommend locking in profits.
If EUR/USD rises during the European session and bears show no energy at 1.0836, a downward correction is likely to continue. In this case, it is better to postpone short positions until a false breakout of 1.0870. You could sell EUR/USD at a bounce from 1.0903, keeping in mind a downward intraday correction of 30-35 pips.
COT report
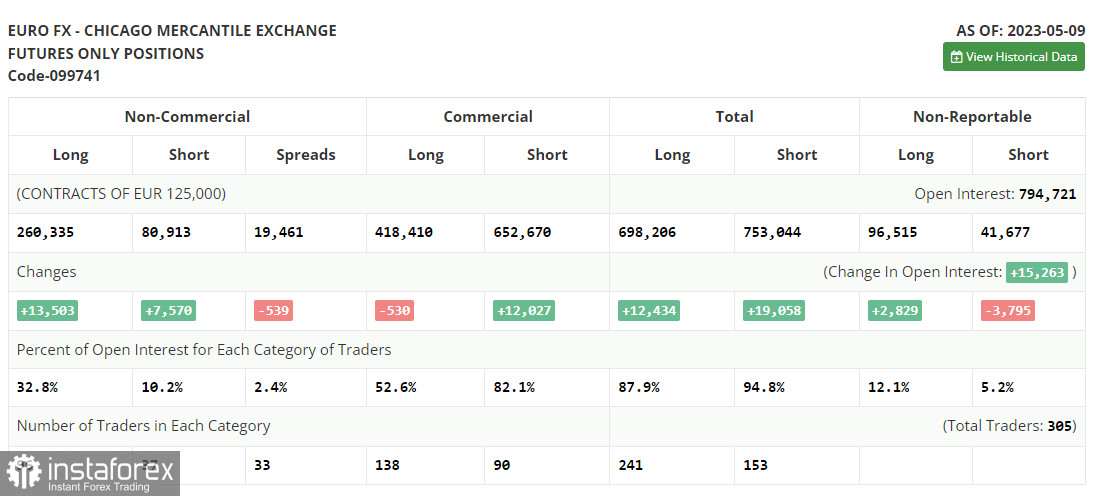
According to the COT report (Commitment of Traders) for May 9, there was a rise in long and short positions. This report takes into account the changes that have taken place in the market after the Fed and ECB meetings. The majority of traders are increasing long positions on the euro. A new downward correction which already occurred last week will provide a buy signal. The euro needs new strong drivers to start a correction. Given that there are no important reports this week and only a few speeches from Fed officials, the pressure on the pair may continue. The COT report indicates that long non-commercial positions jumped by 13,503 to 260,335, while short non-commercial positions advanced by 7,570 to 80,913. At the end of the week, the total non-commercial net position increased to 179,422 against 173,489 a week earlier. The weekly closing price declined to 1.0992 against 1.1031.
Indicators' signals:
Trading is carried out above the 30 and 50 daily moving averages, which indicates a correction phase.
Moving averages
Note: The period and prices of moving averages are considered by the author on the H1 (1-hour) chart and differ from the general definition of the classic daily moving averages on the daily D1 chart.
Bollinger Bands
If EUR/USD declines, the indicator's lower border at 1.0799 will serve as support.
Description of indicators
- Moving average (moving average, determines the current trend by smoothing out volatility and noise). Period 50. It is marked yellow on the chart.
- Moving average (moving average, determines the current trend by smoothing out volatility and noise). Period 30. It is marked green on the chart.
- MACD indicator (Moving Average Convergence/Divergence - convergence/divergence of moving averages) Quick EMA period 12. Slow EMA period to 26. SMA period 9
- Bollinger Bands (Bollinger Bands). Period 20
- Non-commercial speculative traders, such as individual traders, hedge funds, and large institutions that use the futures market for speculative purposes and meet certain requirements.
- Long non-commercial positions represent the total long open position of non-commercial traders.
- Short non-commercial positions represent the total short open position of non-commercial traders.
- Total non-commercial net position is the difference between the short and long positions of non-commercial traders.