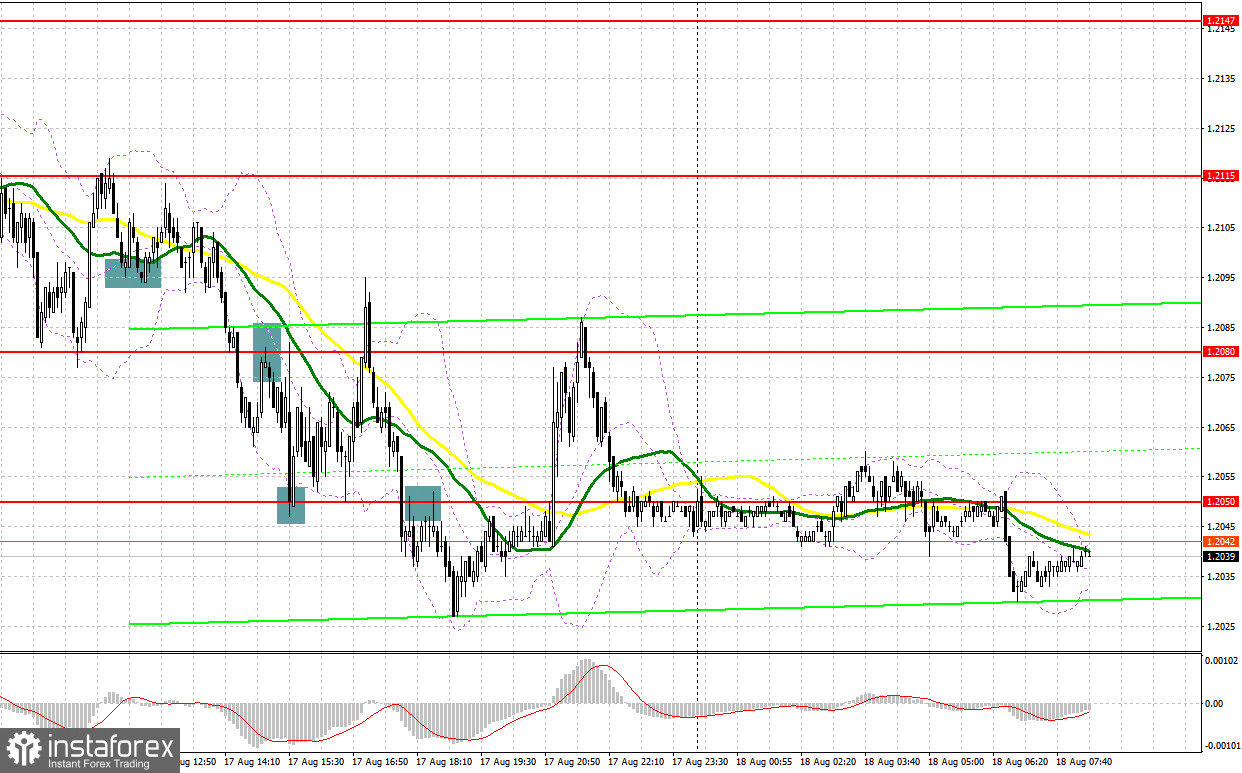
Quite a lot of interesting market entry signals were formed yesterday. Let's take a look at the 5-minute chart and see what happened. I paid attention to the 1.2099 level in my morning forecast and advised making decisions from it. Instant breakthrough of 1.2099 occurred without a reverse test from the bottom up, which was literally 1 point short. Those who still sold on this correction could take about 25 points from the market. In the afternoon, we watched a breakthrough and reverse test from below the level of 1.2080, which gave an excellent signal to sell, resulting in a fall of more than 30 points. A false breakout at 1.2050 and a buy signal led to the pair rising by 45 points. At the end of the US session, one could observe the movement under the level of 1.2050 and a sell signal, which amounted to about 17 points.
When to go long on GBP/USD:
Yesterday's release of the minutes of the Federal Reserve's July meeting did not provide much help to risky assets and did not allow the British pound to seriously strengthen its positions. With UK inflation continuing at a record pace, the outlook for the economy looks bleak. The consumer price index in the UK in July this year rose by 10.1% compared to last year after rising 9.4% a month earlier. The final figure was higher than economists' forecasts, which put on inflation growth to 9.8%. Rising food and energy prices made the largest contribution to the index. Today there are no statistics for the UK, so the bulls have nothing more to rely on. Everything so far points to the pair's succeeding decline, so the "blood from the nose" bulls need to protect the nearest support at 1.2019, below which there is emptiness. The best buy scenario would be only a false breakout around 1.2019. In this case, we can expect a surge of GBP/USD upwards to the level of 1.2056, slightly above which the moving averages pass, limiting the pair's upward potential. A breakthrough and test from top to bottom at 1.2056 will indicate the formation of a new upward trend with an update of a more distant target at 1.2084, where I recommend taking profits.
In case GBP/USD falls and no bulls at 1.2019, the upward correction in the pound observed since August 16 will come to an end. In this case, I expect a return of strong pressure on the pair and I advise you to postpone buying until the next support at 1.1989. You can buy there only on a false breakout. I recommend opening long positions on GBP/USD immediately for a rebound from 1.1962, or even lower - around 1.1929, counting on correcting 30-35 points within the day.
When to go short on GBP/USD:
Bears are clearly taking the market back under their control, and now only support at 1.2019 separates from a new major downward movement. I think that today we can safely act on the breakdown of this level, but, of course, the best scenario would be to sell the pound on the rise from the resistance of 1.2056. Forming a false breakout at this level will provide a good entry point with the goal of moving to the support of 1.2019, for which a real fight is unlikely to unfold, since it has already been repeatedly tested. A breakthrough test of this range would provide an entry point for short positions with a fall towards 1.1989. A more distant target will be the area of 1.1962, where I recommend taking profits.
In case GBP/USD grows and the bears are not active at 1.2056, and this may happen subject to some political upheaval, or promises from British politicians to once again provide assistance to the economy, bulls will have an excellent chance of returning to 1.2084. Only a false breakout there will provide an entry point into short positions based on the pair moving down. If there is no activity there, I advise you to sell GBP/USD immediately for a rebound from 1.2115, counting on the pair's rebound down by 30-35 points within the day.
COT report:
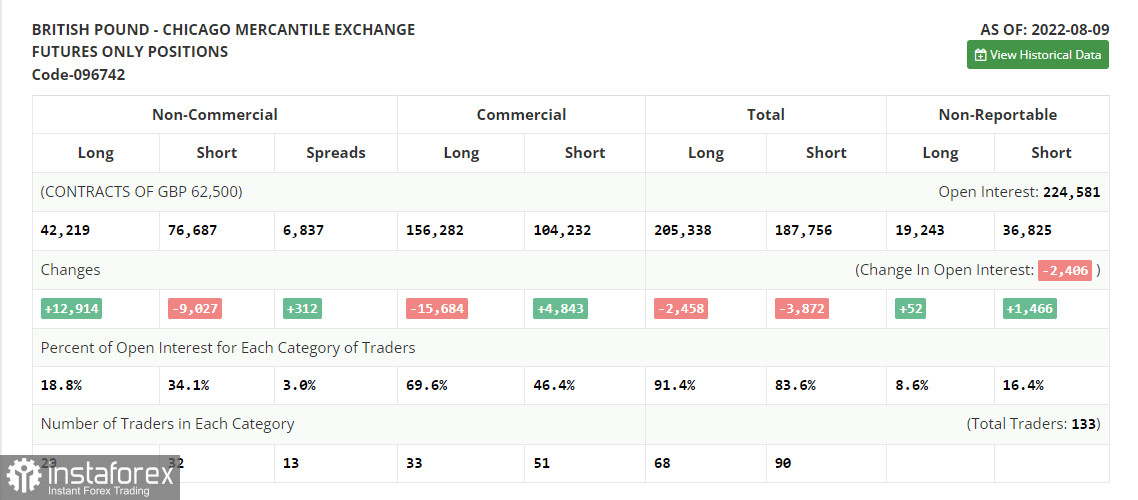
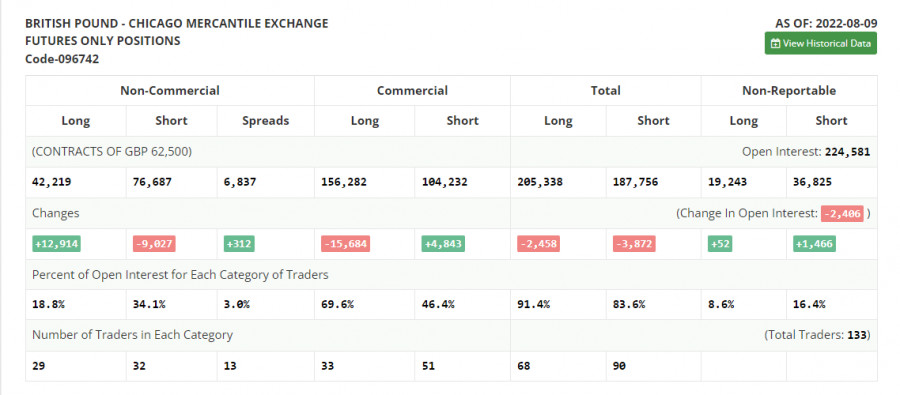
According to the Commitment of Traders (COT) report from August 9, short positions declined, while long positions increased, which led to a decrease in the negative delta. And while a slower contraction in UK GDP in the second quarter of this year will help give us hopes that the economy will weather this crisis more resiliently, it does not make households pay less on their bills, which only exacerbates the crisis in the cost of living in the country. Talk that by the end of this year the UK economy will slide into recession also does not give confidence to traders and investors. Do not forget about how the Federal Reserve's decision affects the GBP/USD pair. Last week it became known that inflation in the US slowed down a bit - this is a good reason to look towards risky assets, but this is unlikely to lead to an increase in the bullish trend for the same pound. Most likely, until the end of the month, we will remain within the wide horizontal channel, since we can hardly count on updating monthly highs. The COT report indicated that long non-commercial positions rose by 12,914 to 42,219, while short non-commercial positions decreased by 9,027 to 76,687, which led to the reduction of the negative non-commercial net position to -34,468 from level -56 409. The weekly closing price decreased and amounted to 1.2038 against 1.2180.
Indicator signals:
Moving averages
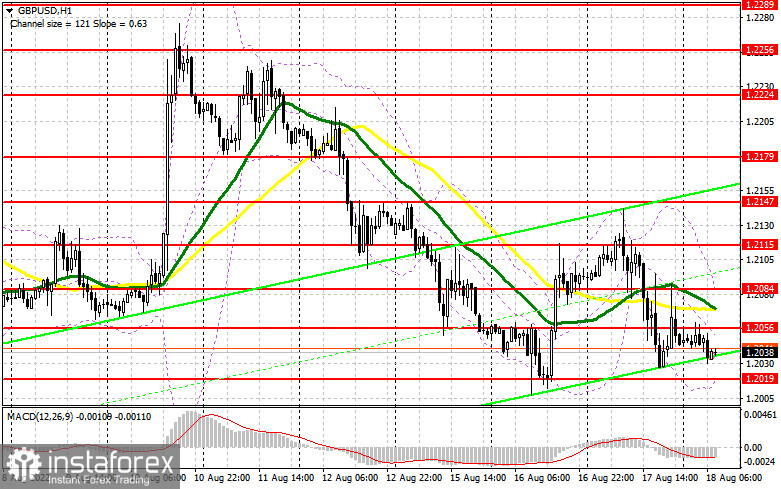
Trading is below the 30 and 50-day moving averages, indicating a return of pressure on the pair.
Note: The period and prices of moving averages are considered by the author on the H1 hourly chart and differs from the general definition of the classic daily moving averages on the daily D1 chart.
Bollinger Bands
In case of growth, the area of 1.2080 will act as resistance. In case of a decrease in the pair, the lower border of the indicator near 1.2019 will act as support.
Description of indicators
- Moving average (moving average, determines the current trend by smoothing out volatility and noise). Period 50. It is marked in yellow on the chart.
- Moving average (moving average, determines the current trend by smoothing out volatility and noise). Period 30. It is marked in green on the chart.
- MACD indicator (Moving Average Convergence/Divergence — convergence/divergence of moving averages) Quick EMA period 12. Slow EMA period to 26. SMA period 9
- Bollinger Bands (Bollinger Bands). Period 20
- Non-commercial speculative traders, such as individual traders, hedge funds, and large institutions that use the futures market for speculative purposes and meet certain requirements.
- Long non-commercial positions represent the total long open position of non-commercial traders.
- Short non-commercial positions represent the total short open position of non-commercial traders.
- Total non-commercial net position is the difference between short and long positions of non-commercial traders.